


- Your body temperature changes throughout your menstrual cycle in response to fluctuating hormone levels.
- In general, your basal body temperature is lower during the first half of your cycle and higher during the second half.
- Oura’s Cycle Insights can help you track your cycle, showing your temperature trends corresponding to your cycle phase.
Throughout your menstrual cycle, your body temperature changes in response to fluctuating hormone levels during the different phases. These temperature fluctuations can provide crucial insights into your menstrual cycle and reproductive health.
Oura can be a helpful tool for spotting changes in your entire body during your menstrual cycle by delivering accurate, personalized resting heart rate, heart rate variability (HRV), respiratory rate, sleep, and body temperature trends.
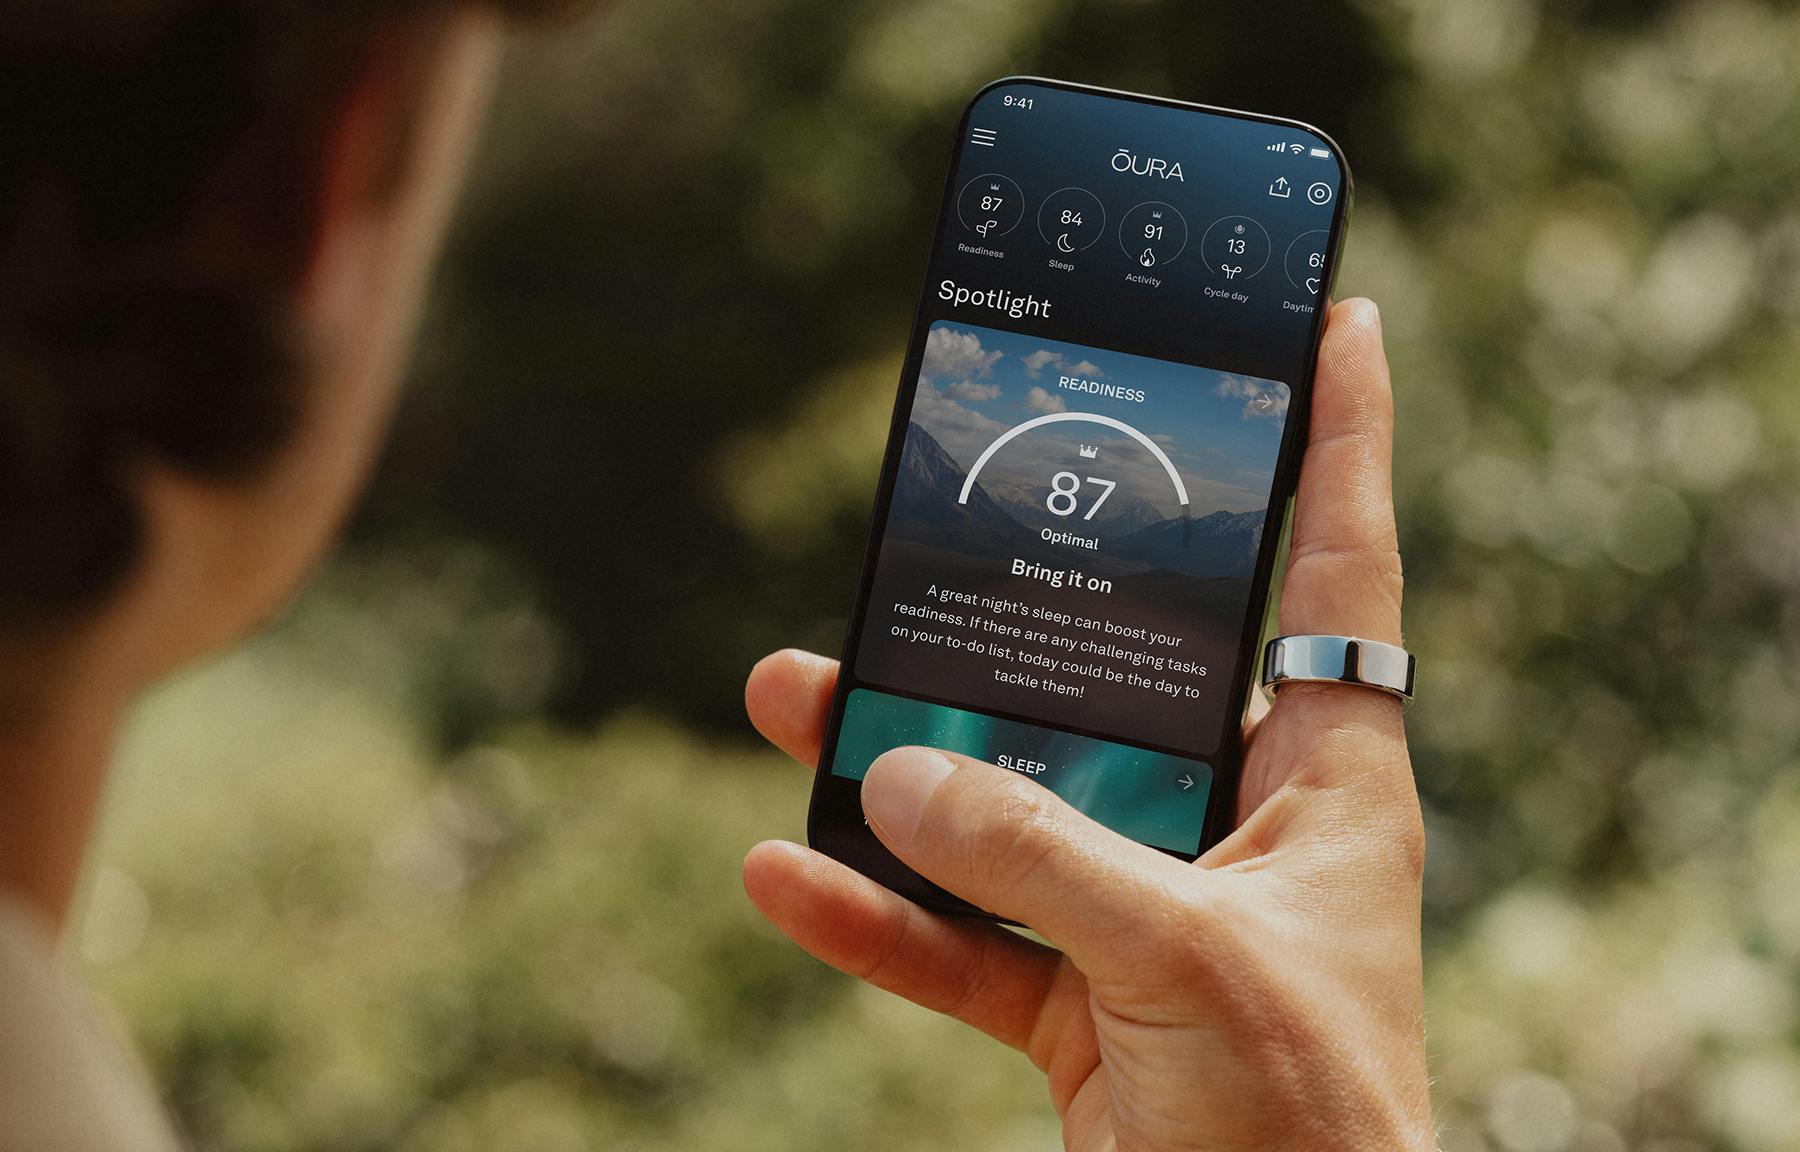
After two months of wearing your ring, Oura’s Cycle Insights feature establishes your body temperature trends, which it uses to forecast the start date of your next period and tell you which phase of your menstrual cycle you’re in. You can view your Body Temperature Graph on the Home screen of your Oura App and tap on the period prediction feature for a more detailed overview.
To help you make the most of Oura’s temperature tracking features, let’s take a look at the four phases of the menstrual cycle and how to track them using Oura.
RELATED: How This Health Coach and New Mom Uses Oura to Prioritize Sleep and Track Her Cycle
How Your Menstrual Cycle Affects Your Body Temperature
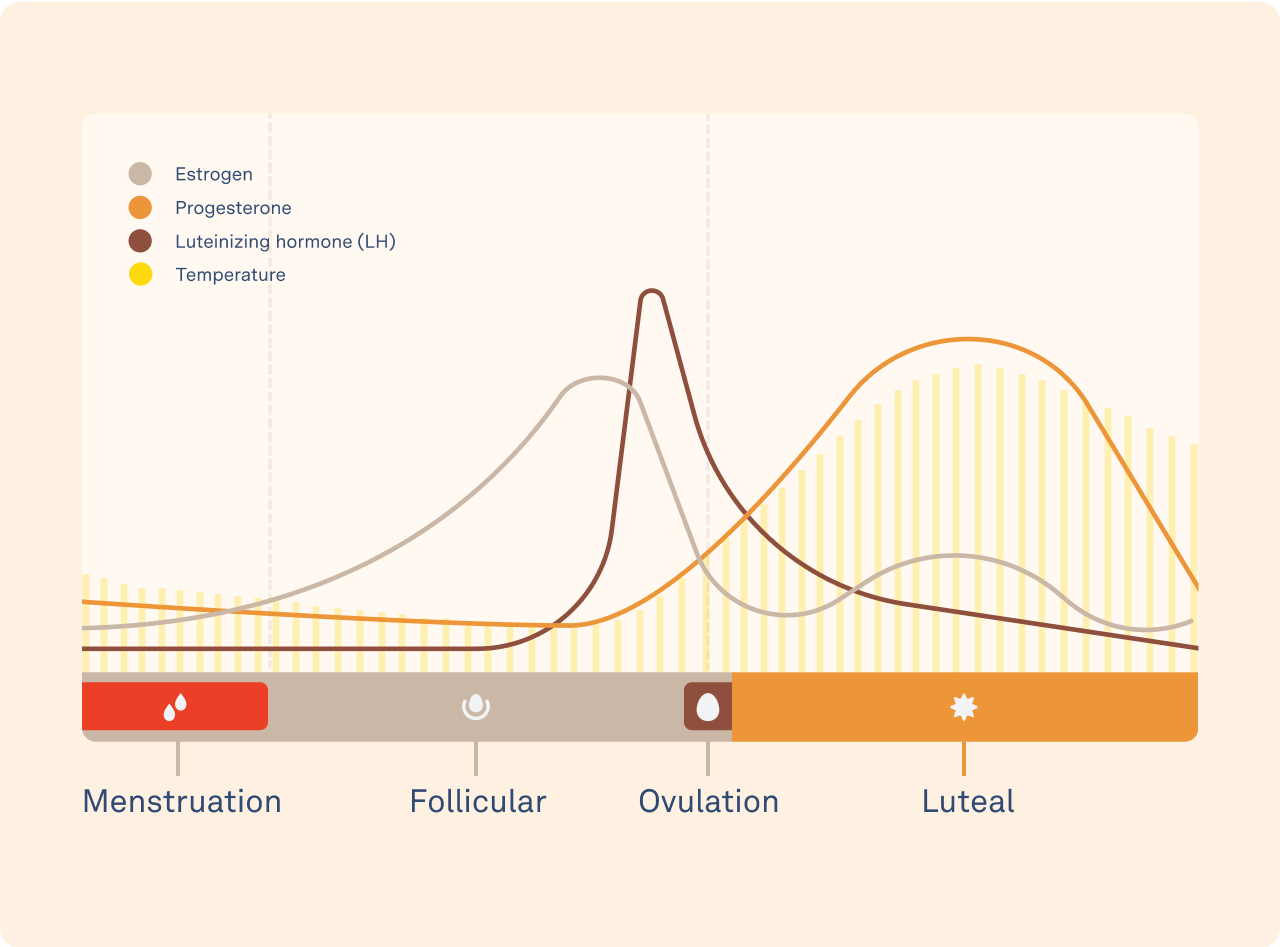
The menstrual cycle has two main phases: the follicular phase and the luteal phase. Some people divide the cycle into four phases, including the menstrual phase and ovulatory phase, in addition to the others. However, these phases occur during the follicular phase. For this reason, on Cycle Insights, you’ll also see if you’re in the follicular or luteal phase.
Each of these phases is characterized by hormonal changes that affect your body temperature in different ways. However, these variations are still relatively small — roughly 0.3°C to 0.7°C (or 0.4°F to 1°F).
However, individual variations exist, and not everyone experiences significant changes in body temperature during their menstrual cycle. Additionally, certain medical conditions or medications can influence body temperature, so it’s important to discuss any concerns about temperature changes with your healthcare provider.
Additionally, if you are using hormonal birth control, you typically will not experience hormonal fluctuations, as the synthetic hormones override your natural hormones.
Menstrual and Follicular Phases
The menstrual phase begins on the first day of your period, which is also the beginning of a new menstrual cycle. A day or two before menstruation starts, your estrogen and progesterone levels drop, causing your body temperature to lower. Menstruation can last between two and seven days, although natural variations are normal.
During the follicular phase, estrogen levels begin to rise while progesterone remains relatively low. Your basal body temperature remains relatively stable throughout this phase.
Ovulatory and Luteal Phases
At the end of the follicular phase, just before ovulation occurs, your body releases luteinizing hormone (LH), a reproductive hormone that triggers the release of a mature egg from your ovary.
During your fertile days, progesterone levels begin to climb, and your body temperature rises in response. This is the most significant change in body temperature that happens during the menstrual cycle. Although this is known as the ovulatory phase, ovulation only occurs on one day of the month.
The last phase of your cycle is called the luteal phase. After ovulation, your progesterone levels and body temperature remain elevated for several days. When progesterone drops at the end of the luteal phase, your body temperature also drops before your next period begins.
RELATED: How Oura Data Can Help You Understand Your Menstrual Cycle
Using Oura to Track Your Cycle
To spot these patterns in your own data, you can use the temperature Trend View, which was designed to help spot long-term patterns like menstrual cycles.
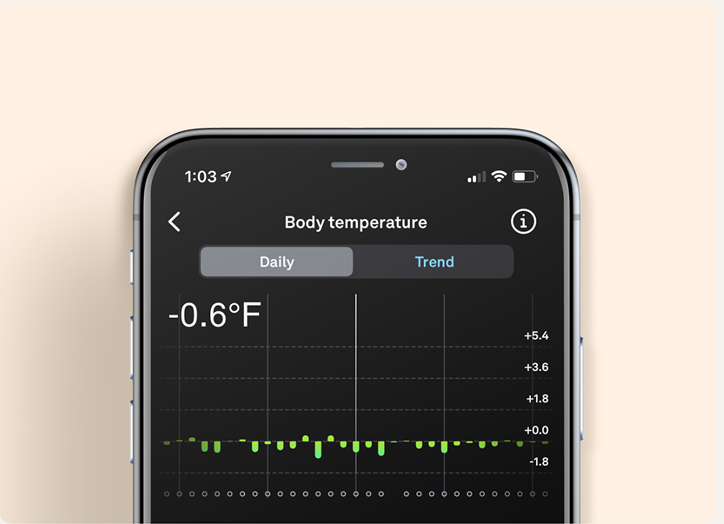
1. In the Oura App, your daily body temperature trend appears on your Readiness tab and answers the question: “How much higher/lower was my temperature last night compared to my baseline?”
2. To see patterns in your temperature trends over time, tap on “Body temperature.”

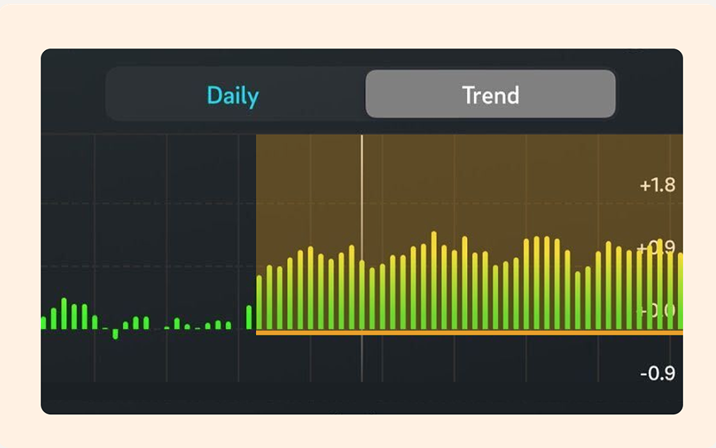
3. You can toggle between long and short-term views of your temperature trends by alternating between the Daily and Trend views of your temperature.
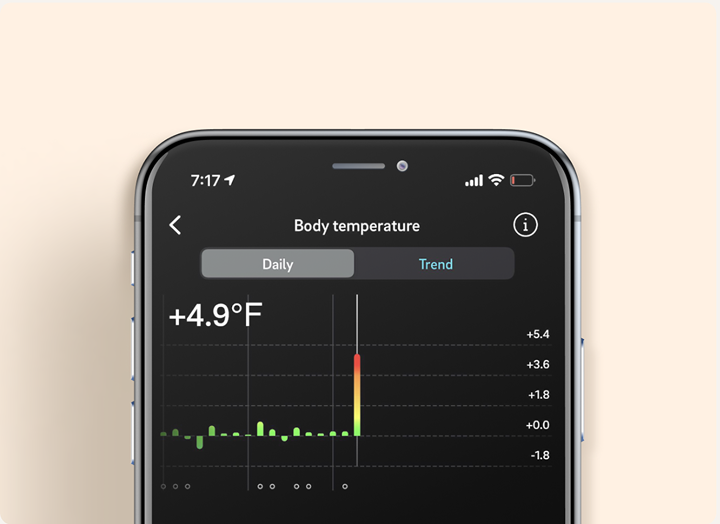
- The Daily view focuses on short-term temperature variations and is optimal for tracking acute reactions in the body like emerging illness and physical, mental, or emotional strain.
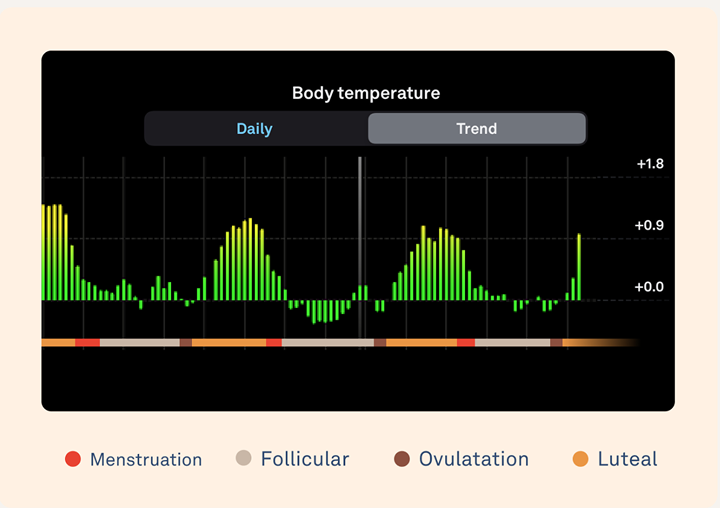
- The Trend view focuses on longer-term changes and is optimized for looking at monthly trends in your data, like menstrual cycles. Each date displays a weighted average of how your body temperature varies from your baseline based on a three-day window — making it easier to spot inflection points (moments of change) at the start of each cycle phase. Those changes occur over multiple days rather than a single night.

4. In your Trend view, keep an eye out for these patterns:

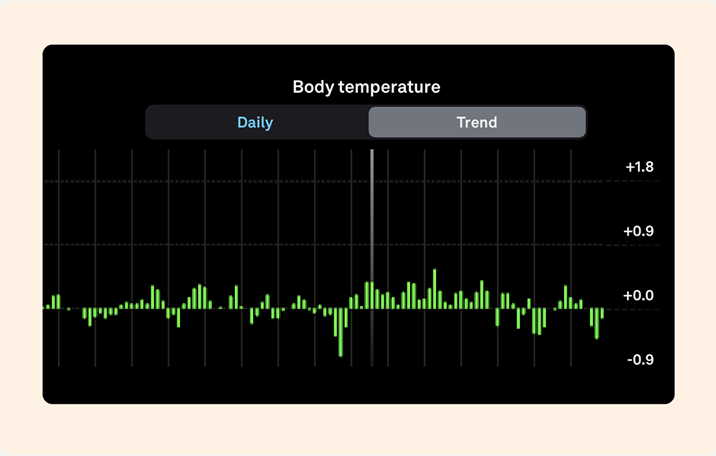
5. If you’re looking for those same patterns in your Daily view, they may be harder to spot:
6. Keep in mind that the temperature trends generally rise slightly, not acutely, during certain phases of the menstrual cycle.
Oura Members Share Their Temperature Tracking Experiences
Keep in mind that cycles vary from person to person and cycle to cycle. Your body is unique, and you may not see these exact patterns. You can read more about why menstrual cycles vary, or discover what patterns other members of the Oura Community have seen with the examples below. All patterns are unique, but these community members shared their findings hoping to help others get started.
Example 1: “I had no idea how long my cycle was until I started tracking….Some of them were shorter, and some were much longer.” – Ramya
Example 2: “I’m actually on hormonal birth control, and I continuously dose so I don’t have a period. It was fascinating to discover that my patterns are totally different, I don’t have phases.” – Casey
Example 3: “My temperature increase is what first made me think I might be pregnant! It went up and stayed up.” – Laura
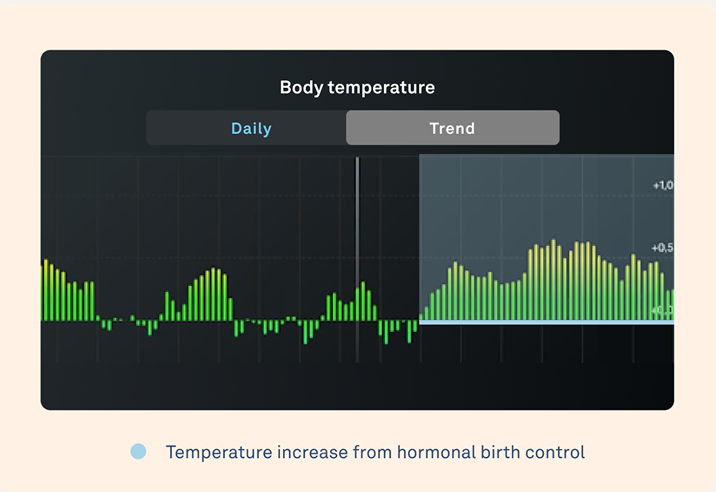
Example 4: “You can really clearly see when I started birth control and my body became warmer. It took some time for my new baseline to adjust.” – Hannah
5 Ways to Support Your Hormonal Health
Women’s bodies are highly sensitive to lifestyle and environmental factors that can affect their hormonal balance. Use these tips to support your hormones and promote a healthy menstrual cycle.
1. Make Sure You Get Enough Sleep
Getting the right amount of quality sleep is essential for healthy hormones. Use Oura’s personalized bedtime recommendations and your chronotype to manage your nighttime routine, and aim to go to bed and wake up at the same time each day.
READ MORE: How This Oura Member Learned to Embrace Her “Evening” Chronotype and Align to Her Ideal Schedule
| Member Tip: Use your Sleep Score and Sleep Graph to regularly assess the quality of your sleep. For instance, if you notice you’re not getting enough deep sleep, you might want to try going to bed earlier or drinking less caffeine during the day. |

2. Track Your Temperature
Keep an eye on your basal body temperature throughout your menstrual cycle using Temperature Trends in your Oura App. This can help you identify patterns and fluctuations in your temperature that can provide clues about your hormonal levels.
3. Manage Your Stress Levels
Stress can impact hormonal balance and affect your menstrual cycle. Practicing stress-reduction techniques, such as meditation, yoga, or deep breathing exercises may help reduce stress and stabilize your hormones. Your HRV can also tell you a lot about your stress levels. If you notice your HRV is lower than usual, it could be an indicator of stress.
| Member Tip: You can track your stress using the Daytime Stress feature. If you notice you are often in a Stressed state, try to unwind – head to Explore content in your Oura App to access breathing exercises and guided meditations that can help you relax and unwind. |
RELATED: HRV and Stress: What HRV Can Tell You About Your Mental Health
4. Incorporate Healthy Habits
A healthy lifestyle can support hormonal balance and overall well-being, so try to prioritize a balanced diet, regular exercise, and sufficient sleep.
READ MORE: 8 Foods and Drinks for Better Sleep (And the Four to Avoid!)
5. Rule Out Medical Conditions
If you notice drastic temperature changes outside your normal range, it may indicate a medical condition, such as an infection, hormonal imbalance, or thyroid disorder. Your healthcare provider can perform the necessary tests to rule out any underlying health problems.
READ MORE: Member Gabrielle B. Turns to Oura to Manage Her Reproductive and Mental Health