


Your menstrual cycle naturally varies — understanding when and why it changes can be an empowering clue to your health.
Oura can help you understand the variability of your cycle, so you can feel informed when it comes to your reproductive health. With our Cycle Insights feature, Oura Ring can track where you are in your cycle, providing you with a five-day prediction window for your period.
Oura now also integrates with Natural Cycles, the first FDA-cleared non-hormonal birth control app. So whether you’re trying to plan or prevent pregnancy or track menopause, you can do so using your Oura data.
These features reflect Oura’s commitment to women’s health by empowering you with tools and actionable insights to better understand your menstrual cycle.
READ MORE: Oura Partners With FDA-Cleared Birth Control App, Natural Cycles°
Oura’s Research in Women’s Health
Researchers at Oura wanted to understand more about how menstrual cycles vary — and also wanted to help women understand their own patterns. To learn more, we compiled anonymized data across 40,000 menstrual cycles from Oura members.
The results demonstrate that Oura’s temperature data can provide a personalized signal for individuals who want to learn more about their cycles. This research expands on existing findings that Oura can be used as a helpful tool to help you learn more about your own personal cycling patterns, especially for menstrual cycle phases and key fertility signals.
Here are the top findings:
Oura Temperature Data May Help You Understand Clear Cycle Patterns
Temperature naturally fluctuates across the menstrual cycle because it is highly impacted by hormones like estrogen and progesterone. Although there are some complex dynamics at play, generally:
- Estrogen decreases your temperature in the first half of your cycle.
- Progesterone, in combination with estrogen, raises your temperature in the second portion of your cycle, after ovulation.
Menstruation occurs at the start of each cycle, following a decline in estrogen, progesterone, and temperature.
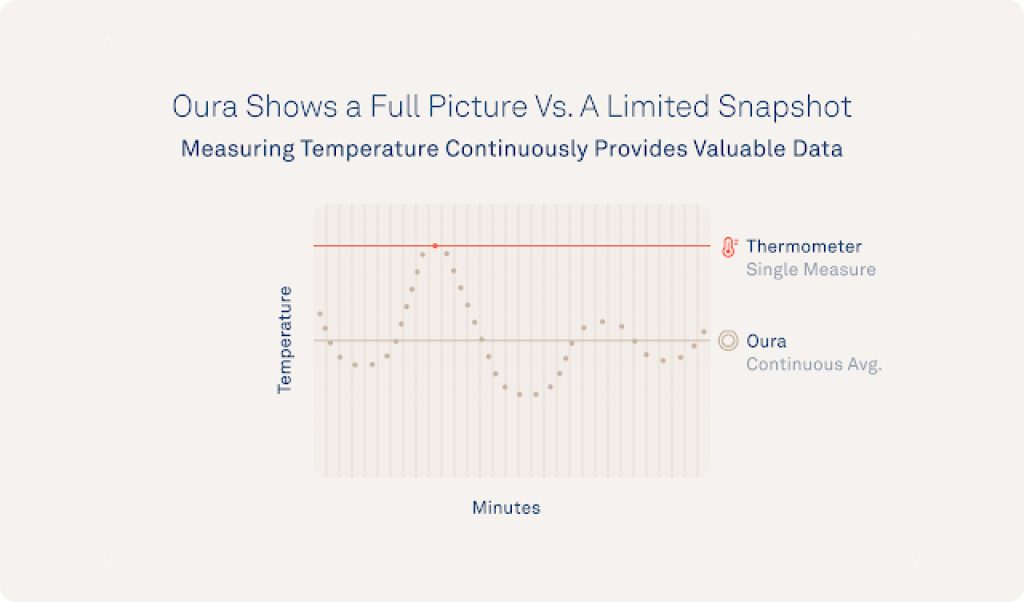
While some cycle and fertility tracking measurements rely on oral thermometers estimating your “BBT” or basal body temperature once per day, Oura measures temperature 24/7, directly from your skin.
READ MORE: How Accurate Is My Oura Temperature Data?
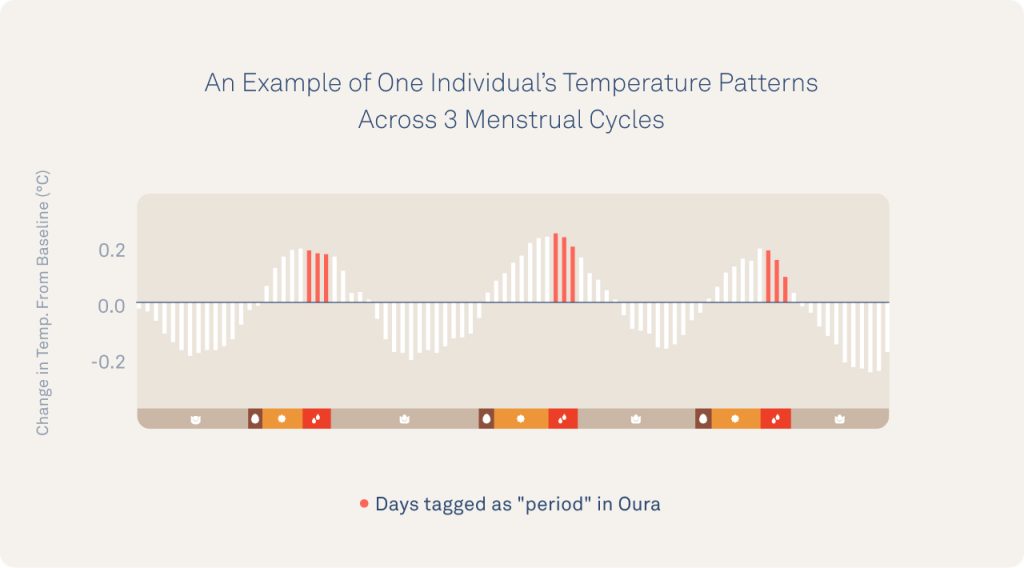
Oura measures your nighttime body temperature relative to your personalized baseline, so you can easily see when your temperature starts to drop near menstruation or changes for each cycle phase.
Nocturnal Oura temperature deviation exhibits a biphasic pattern across the cycle, and researchers have found that the continuous temperature signal gives members the tools so they can interpret their data, which an oral thermometer can’t do well, like the preovulatory LH surge.
In the graph below, you can see an example of temperature rising and falling over three cycles for one individual. Using this distinct pattern, Oura researchers can investigate how cycles change over the course of many days or months.
Oura Data Can Identify Long, Short, And Irregular Cycles
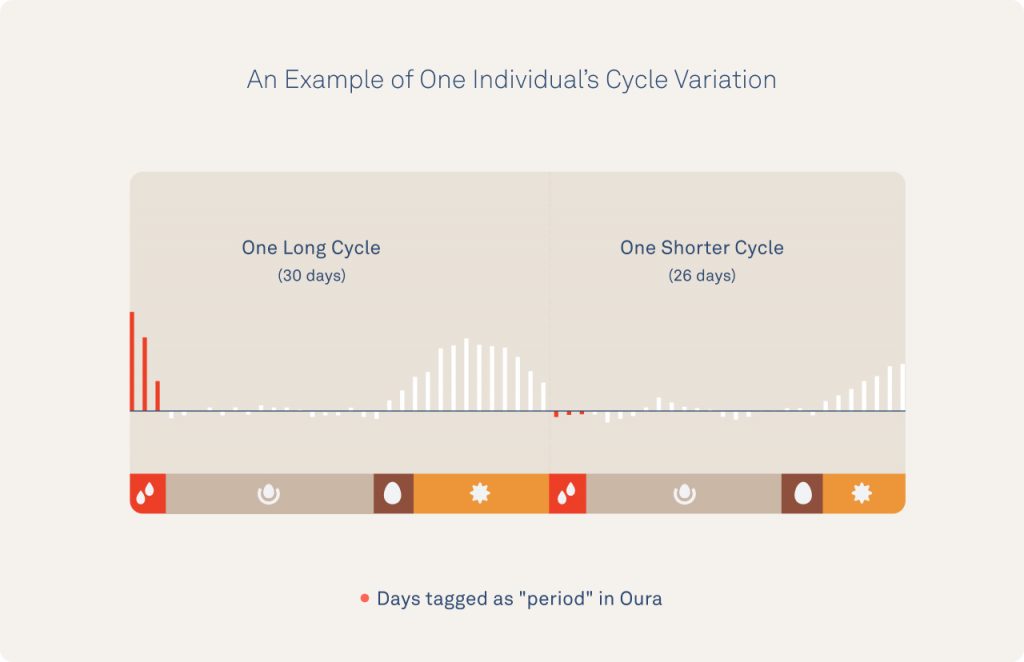
While the example above follows a consistent pattern, we know that cycles have incredible variability.
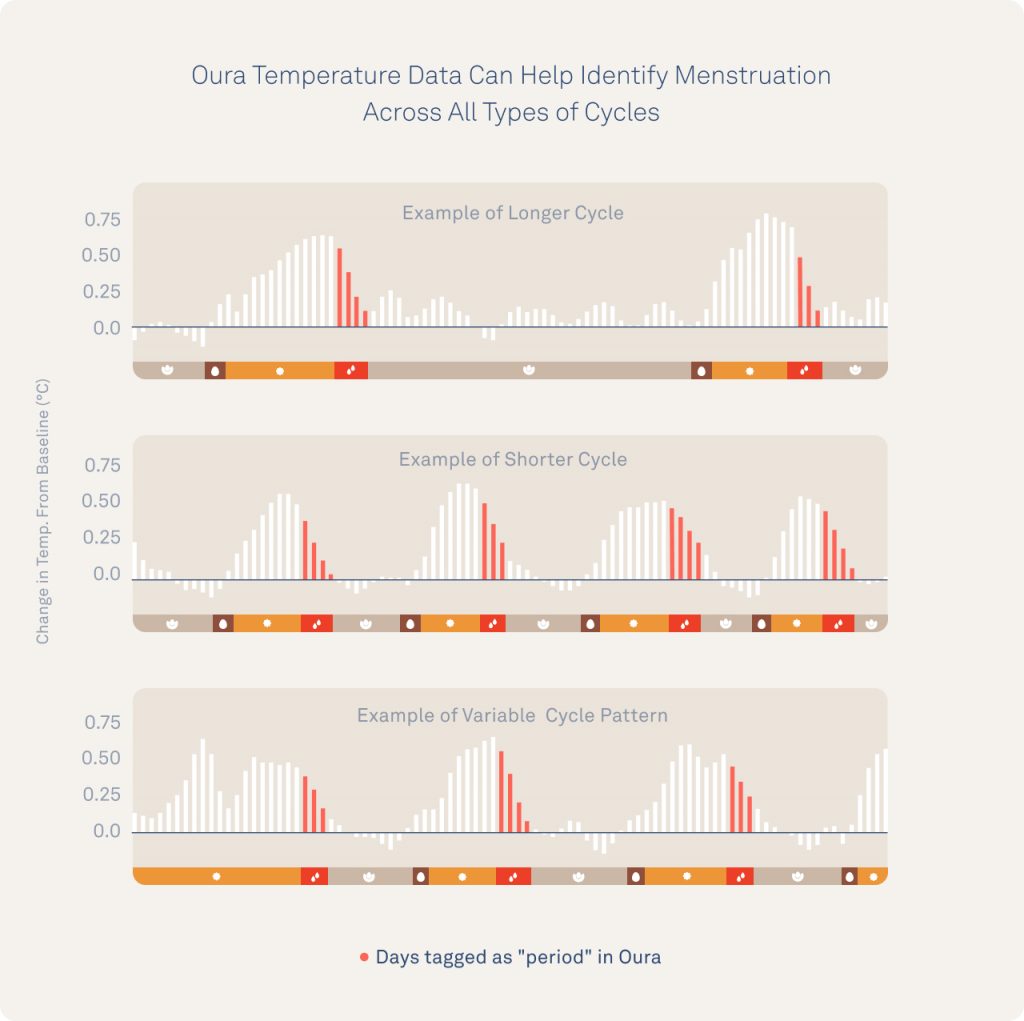
Oura members can review their temperature data and look for cycle patterns. Members can also view their temperature data and look for cycle patterns like the examples below that are long (58 days between periods), short (20-25 days), or highly variable.
Note: In the image below, the follicular phase, luteal phase, and ovulation are estimated.
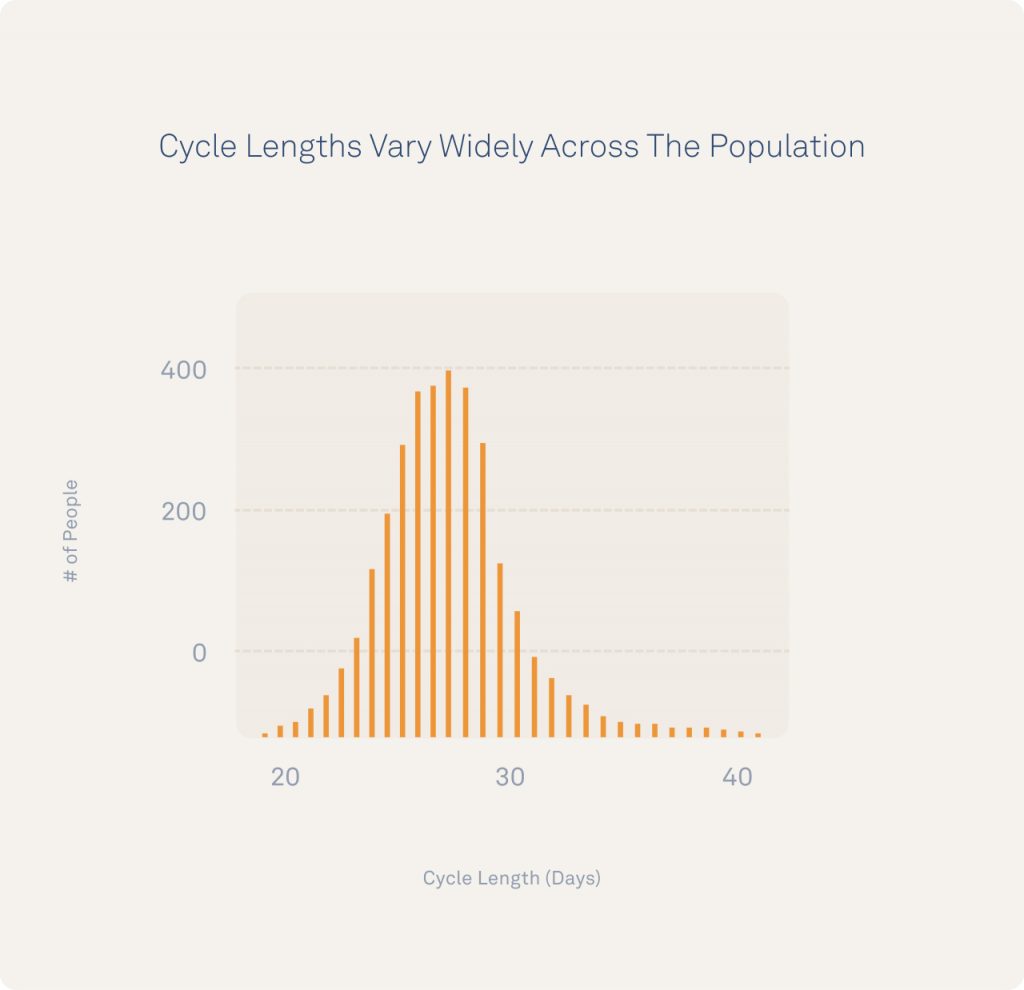
Oura Data Captures Population Variation
Although the “average” cycle length was around 28 days, cycles varied in length from 20-40 days and each individual showed a personal variation of +/- 8 days from one cycle to the next on average. Note that in each case, menstruation was reported on during a time of declining temperatures during the late luteal phase.
How your body changes from cycle to cycle can be a key window into whether your body is fluctuating normally or if there’s something like stress, illness, or a medical condition that may need your attention.
Why Do Cycles Vary?
Cycles are traditionally referred to as “regular” or “irregular” based on how cycle length varies. That length can change when any one of your cycle events becomes shorter or longer.
There’s a common misconception that most women’s cycles are 28 days long when, in fact, research shows this may only represent ~13% of the population, and cycles can range from ~20-40+ days. It’s even normal to have a cycle that skips ovulation from time to time, known as an “anovulatory cycle.”
READ MORE: Busting the 14-Day Ovulation Myth
Many factors may impact your cycle variability:
- Cycles tend to grow shorter with age prior to perimenopause.
- Cycles are impacted by your genetic background and body composition.
- Cycles may show irregularity after recovering from past birth control usage, life stress, travel, an irregular schedule, illness, or over-training/prolonged athletic demands.
- Cycles may become irregular due to a medical condition like obesity, metabolic syndrome, or polycystic ovary syndrome (PCOS).
- Cycles may change after giving birth. The return to cycling is strongly impacted by breastfeeding frequency, with more frequent feedings over a longer postpartum period preventing ovulation and menses for longer (don’t worry – this kind of cycle cessation is healthy for both you and your baby!).
READ MORE: How to Align Your Training With Your Menstrual Cycle
How to Use Oura Insights For Menstrual Tracking
How your body changes from cycle to cycle can be a key window into whether your body is fluctuating normally or if there’s something like stress, illness, or a medical condition that may need your attention.
Many individuals have irregular cycles, often due to a variable length of time between menstruation and ovulation. For example, if your body is under prolonged psychological or physical stress (think a major change at work, severe flu, or unusually strenuous, prolonged exercise), it may stop ovulation by preventing the boost of luteinizing hormones known as your “LH surge” that acts as your body’s “go signal” to ovulate. This can make it hard to anticipate either fertile days or predict your next period.
Using the Cycle Insights feature, you’ll have increased awareness of what’s happening in your body and monitor where you’re at in your cycle. If you’re using this data to plan or prevent a pregnancy, syncing Oura with Natural Cycles can make it easy to anticipate fertile vs. non-fertile days.
You can also look at your Trend view and use Tags to see patterns and monitor cycle events and symptoms.
Researchers at Oura will continue to look for meaningful patterns, partner with outside experts, and share what we learn with Oura members.
In the meantime, if you’ve seen changes in your own cycle that might empower others – share your story with us.