


How accurately does the Oura Ring measure your heart rate and HRV?
In this 2020 study, which involved 49 healthy adult subjects, researchers sought to validate the accuracy of the Oura Ring in measuring resting heart rate (HR) and heart rate variability (HRV), both of which are essential metrics for measuring recovery and overall health.
How Accurate Is Oura Ring?
The researchers found “very high agreement” between the Oura Ring and the gold-standard, ECG measurement. The Oura Ring performed near-perfect for resting heart rate (r² = 0.996) and extremely well for heart rate variability (r² = 0.980) when compared to a medical-grade ECG device.
“Think about it for a second: we compared a 4-gram smart ring with a medical-grade ECG device and saw how well it holds up,” says Hannu Kinnunen, lead study author and Oura’s Chief Scientist at the time. “This level of accuracy opens up new possibilities for understanding what state your body is in.”
Despite the capability to track even the smallest changes, Kinnunen emphasizes that it’s the big picture that counts: “It’s not enough to know that your heart rate is, say, 52 bpm with zero-point-something accuracy. What’s meaningful is that Oura lets you see cause and effect: you start exercising and your HR drops by 5 bpm, or you get sick and your HRV drops by half, and your HR jumps by 10 bpm. That’s why accuracy in the long term becomes meaningful.”
More Findings from the Study
In a study of 49 healthy subjects, Oura Ring was shown to be:
- A valid tool for measuring average nighttime resting heart rate (RHR) & variability (HRV)
- A highly accurate means of assessing body signals and long-term health behavior
Let’s dig into the data.
Oura’s Average Nighttime Values Correspond Near-Perfect with ECG
When comparing Oura’s average nighttime RHR and HRV to a medical-grade ECG device, the results showed a near-perfect correlation for RHR (r² = 0.996) and extremely high squared correlation for HRV (r² = 0.980).
If you’re not familiar with r squared (r²), it is a commonly used way to assess how well two values correspond. It ranges from 0 to 1 where 0 means there’s no correlation while 1 means the two variables are completely in sync.
Because both of these r² are very close to 1, it means that the values in the Oura app are at the top of the accuracy range and correspond nearly perfectly with ECG values, the gold standard for measuring heart rate.
RELATED: While both metrics vary by individual, find an analysis of Oura members’ average HRV here and average resting heart rates here.
And here’s what those results look like in the raw data:

Oura’s Nighttime RHR and HRV Graphs Show Very High Agreement with ECG
In addition to the single score you get for RHR or HRV, Oura also provides a graph of your data throughout the night. These graphs are made up of tons of data points that each represent a 5-minute segment of your data, connected over time.
When you compare these segments to ECG data for individual nights, the agreement between these 5-minute segments is high for both RHR and HRV but shows more higher variation than the nightly values, depending on the individual.
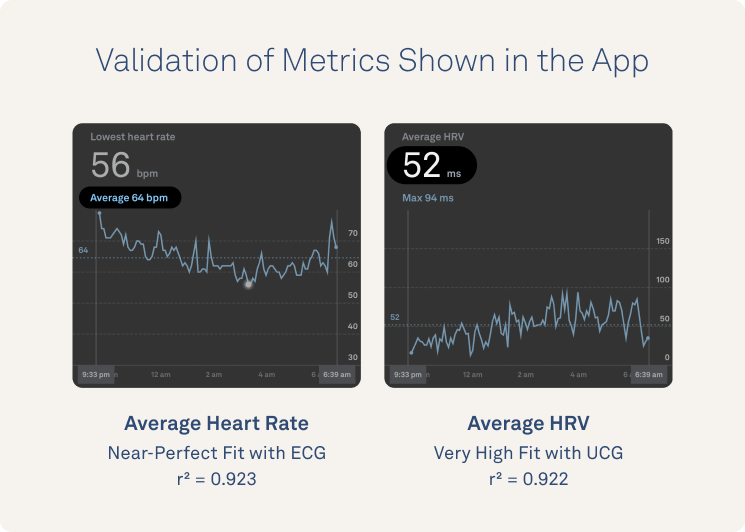
Here’s where you can find this data within the app in your RHR and HRV graphs for the night:
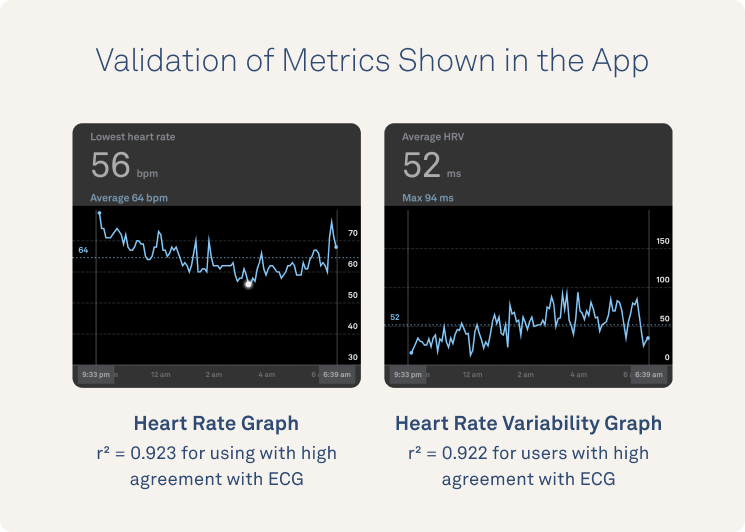
And here’s how those values look within the raw data when you look at the variability between different types of individuals whose data is more or less likely to match when you compare Oura and ECG.
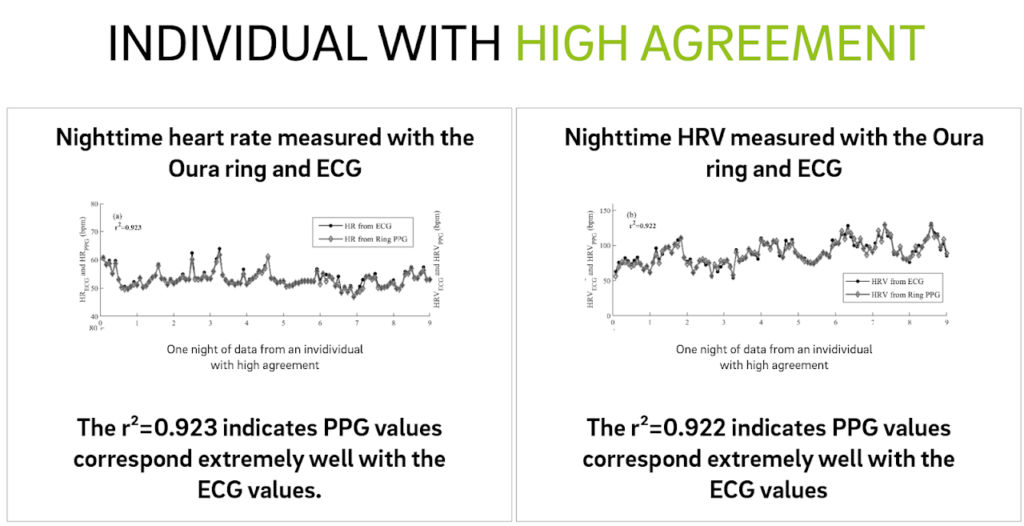
For example, for an individual with high agreement, the relationship between these 5-minute segments is very high for both RHR (r² = 0.923) and HRV ( r² = 0.922). How can you tell? The graphs look nearly identical between the values from Oura (PPG) and ECG:
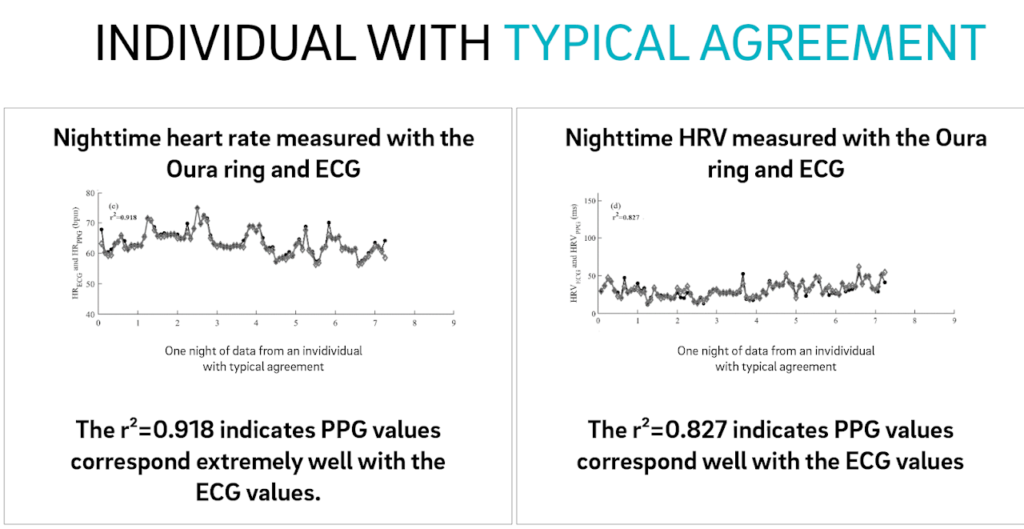
For an individual with typical agreement, the results are similar but show more variation. This is the case for the average Oura user. The agreement varies from person to person and night to night. Overall, the relationship shows very strong alignment between ECG and Oura (PPG) values for 5-minute segments for both RHR (r² = 0.918) and HRV (r² = 0.827).
Once again, the graphs look extremely similar in an individual with typical agreement:
At Oura, we’re always working to innovate and make the algorithms behind your Oura metrics even stronger! We’ll continue to share new studies and results as they become available.