


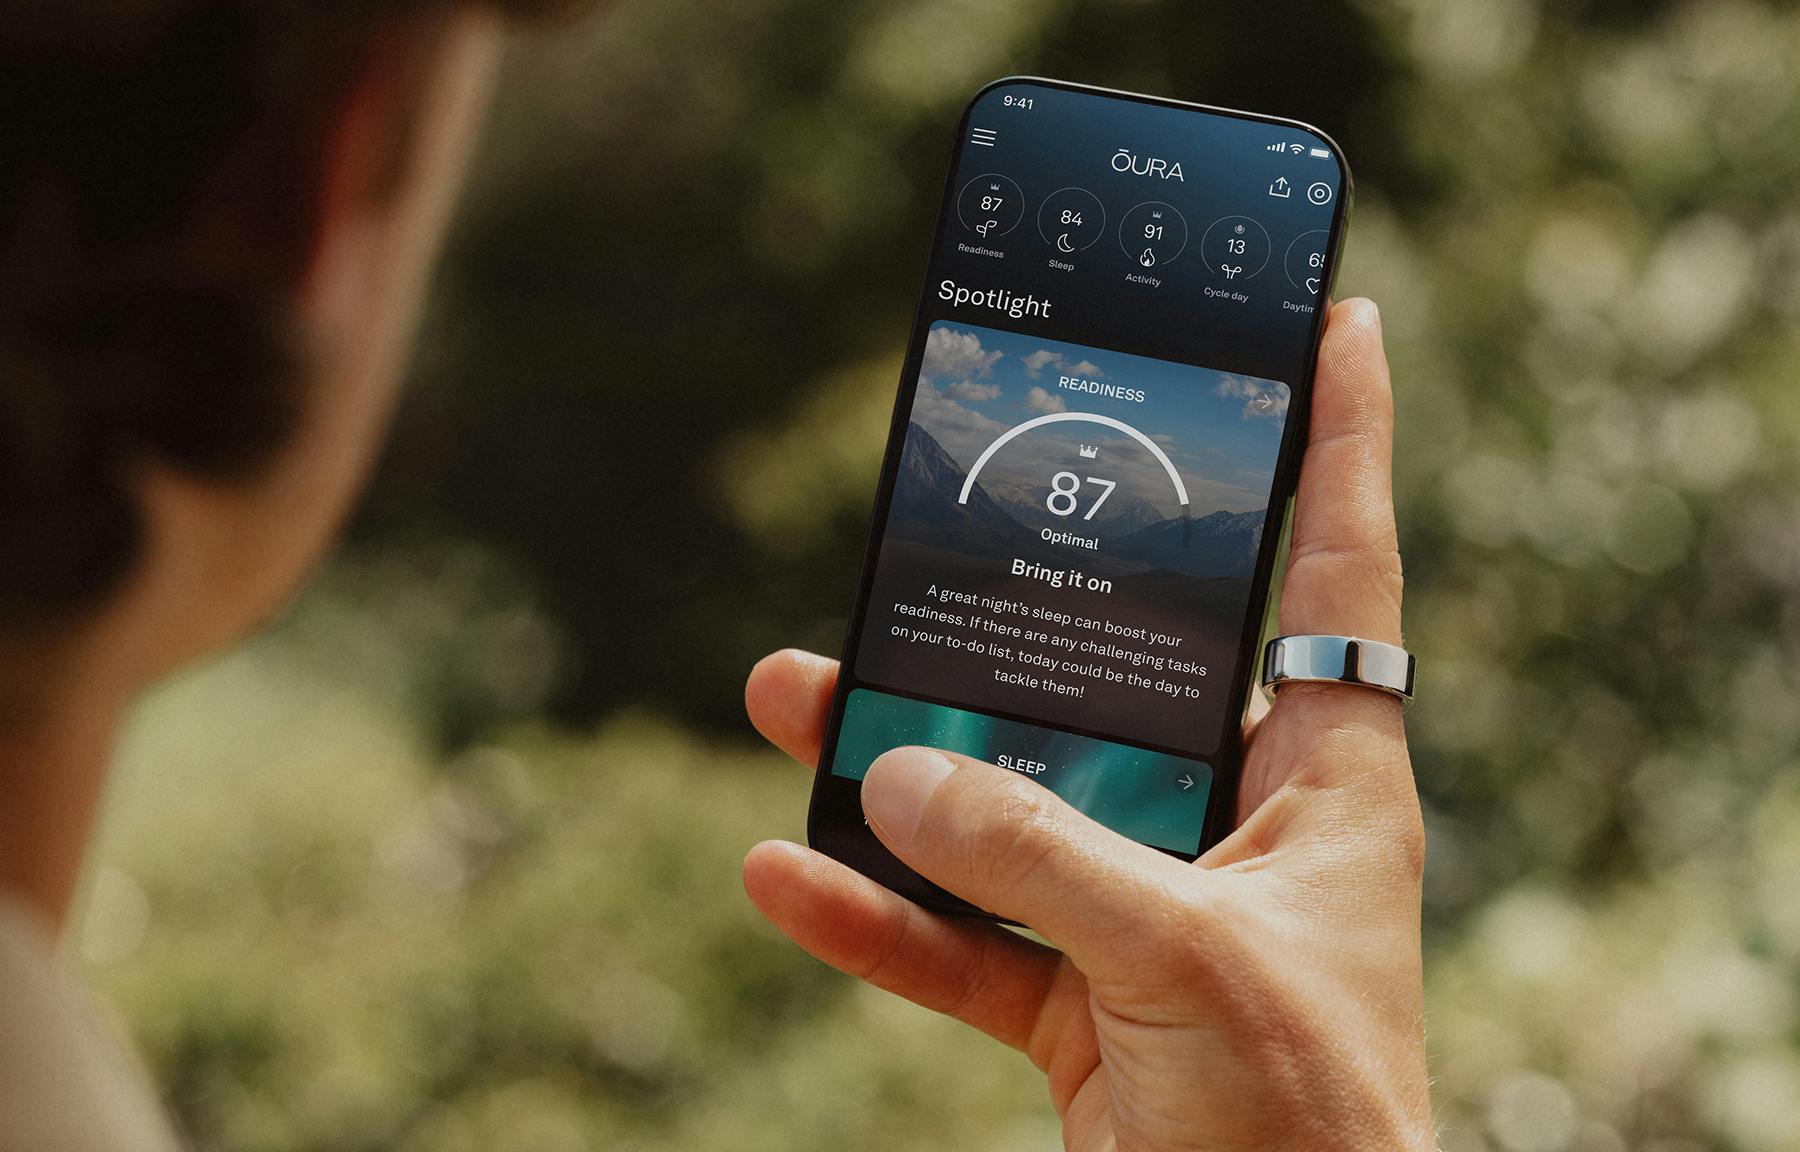


In the Oura App, Oura members can now find their Seasonal Report. This shareable report brings insights from your health journey to life through stats based on your Oura data. In your personalized report, you’ll discover how many crowns you racked up, your typical bedtimes and wake-up times, how many steps you took, and more data points from the last 90 days.
To find your Seasonal Report, go to the Oura App Home Tab, tap the hamburger menu in the top left, tap Reports, then tap Seasonal. You can also humblebrag about your accomplishments with your friends and family. To share your Seasonal Report simply tap the share icon in the upper right-hand corner to send the image through social media or messages.
Learn more about your Oura reports in the Help Center here.
Based on aggregate data from the past 90 days, some interesting trends emerged, including how Readiness Scores vary across the week to the most popular workouts among our members. Below, we’re sharing three of our favorite findings based on Oura community data from July through September 2022.
1. Readiness Scores are lower on Fridays and Saturdays and highest on Mondays.
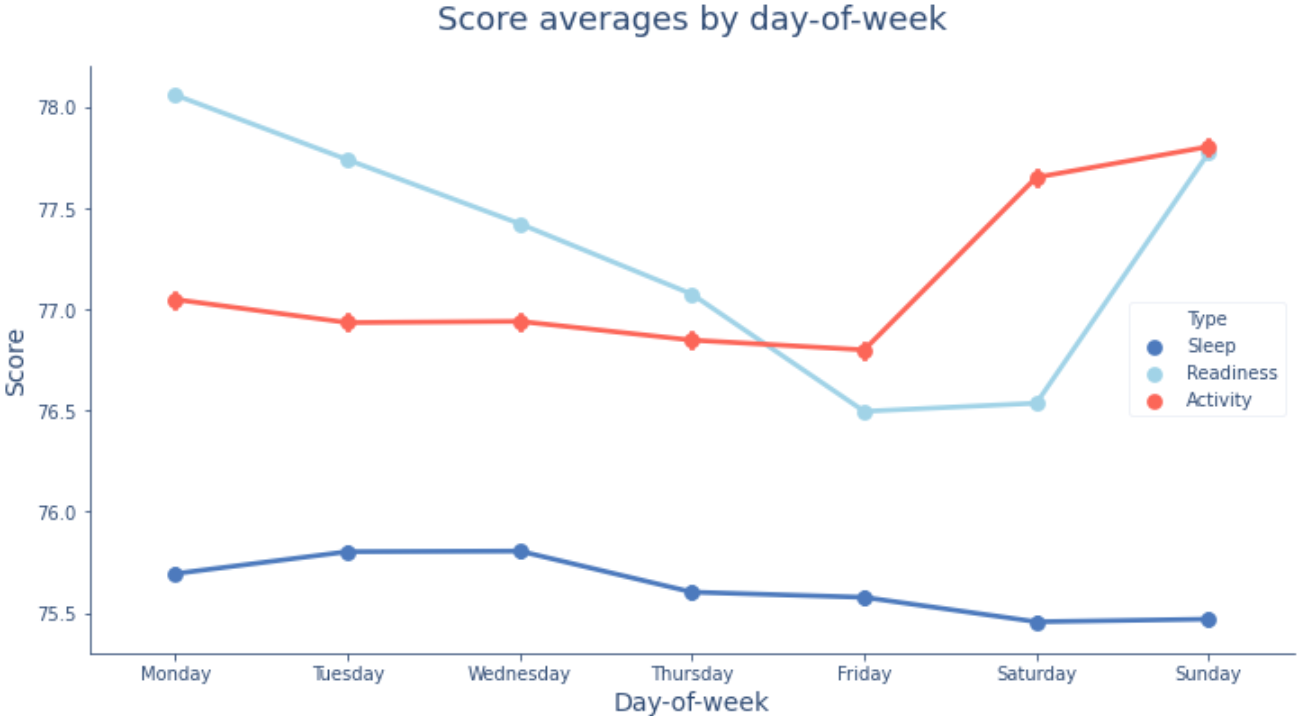
Note that the days correspond to Oura “Sleep Days” — for example, the label “Friday” corresponds to the sleep day for Friday, which is 6pm on Friday to 5:59pm on Saturday.
In the chart above, you’ll see that weekends have a significant impact on Oura members’ Activity and Readiness Scores. Clearly, we’ve got some Weekend Warriors in the community, with Activity Scores peaking on Sundays, while Readiness Scores plummeted on Friday and Saturdays — likely impacted by activities like going out, partying, or otherwise having fun on these nights. (It’s all about balance, after all!) Members’ Sleep Scores tend to stay more consistent throughout the week.
READ MORE: What is HRV Balance?
2. Oura members are an active group; their top activities include walking, cycling, and running.
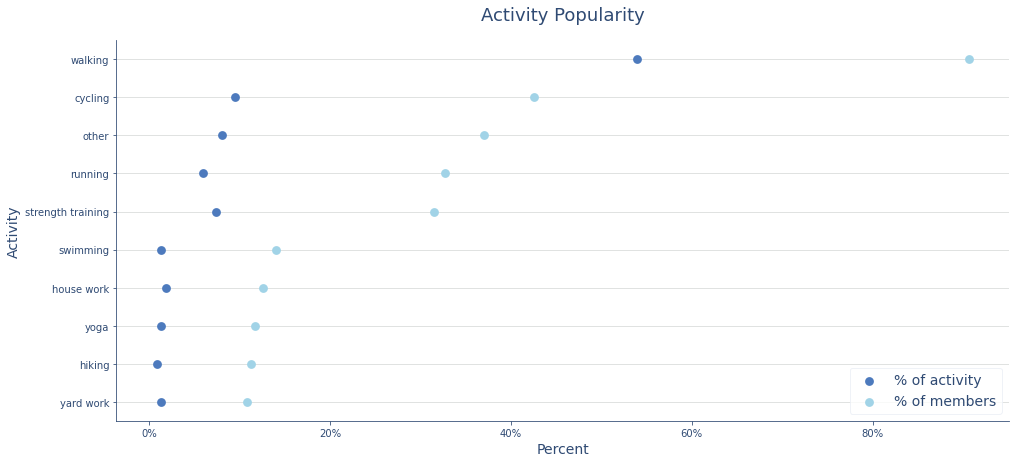
Over the last 90 days, 72% of Oura members logged at least one workout, meaning they confirmed an automatically detected activity, imported one from a connected app, or manually added a workout. What were they so busy doing? The chart above shows the top ten most frequently tagged workouts in the Oura App, broken down by percentage of activities and percentage of members who logged at least one workout. Walking, cycling, running, strength training, and “other” workouts took the top 5 spots.
3. Oura members are most active midday and in the early evening.
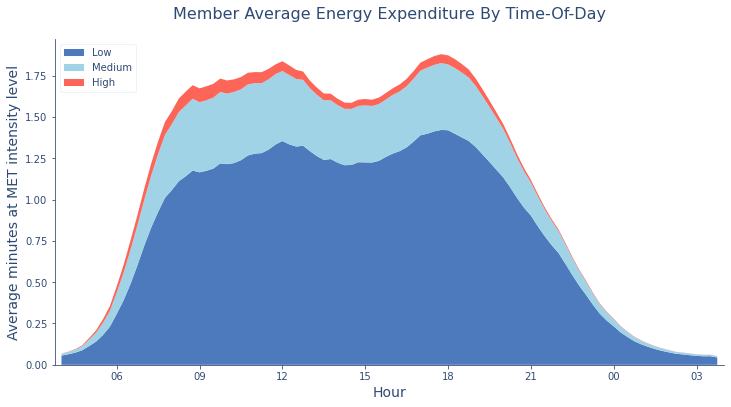
In this chart, you’ll see two distinct peaks for energy expenditure (measured in METs, or metabolic equivalents) just before lunchtime and in the early evening with a lull in-between. Keep in mind that energy expenditure isn’t necessarily “working out;” it can also include activities like walking, housework, or physical activity at work. The most active 15-minute segments are: 12pm, 5:45pm, 6pm, 5:30pm, and 12:15pm.
You’ll also notice less energy expenditure while members are sleeping, but notice how that the y-axis doesn’t go down to zero, reflecting not only the fact that this is an average across members, but also that you still expend some energy while you’re sleeping — just less!
RELATED: What Is the Average Resting Heart Rate for Oura Members?