


The end of the year offers a perfect time to reflect on your progress, accomplishments, and achievements from the start of the year until now.
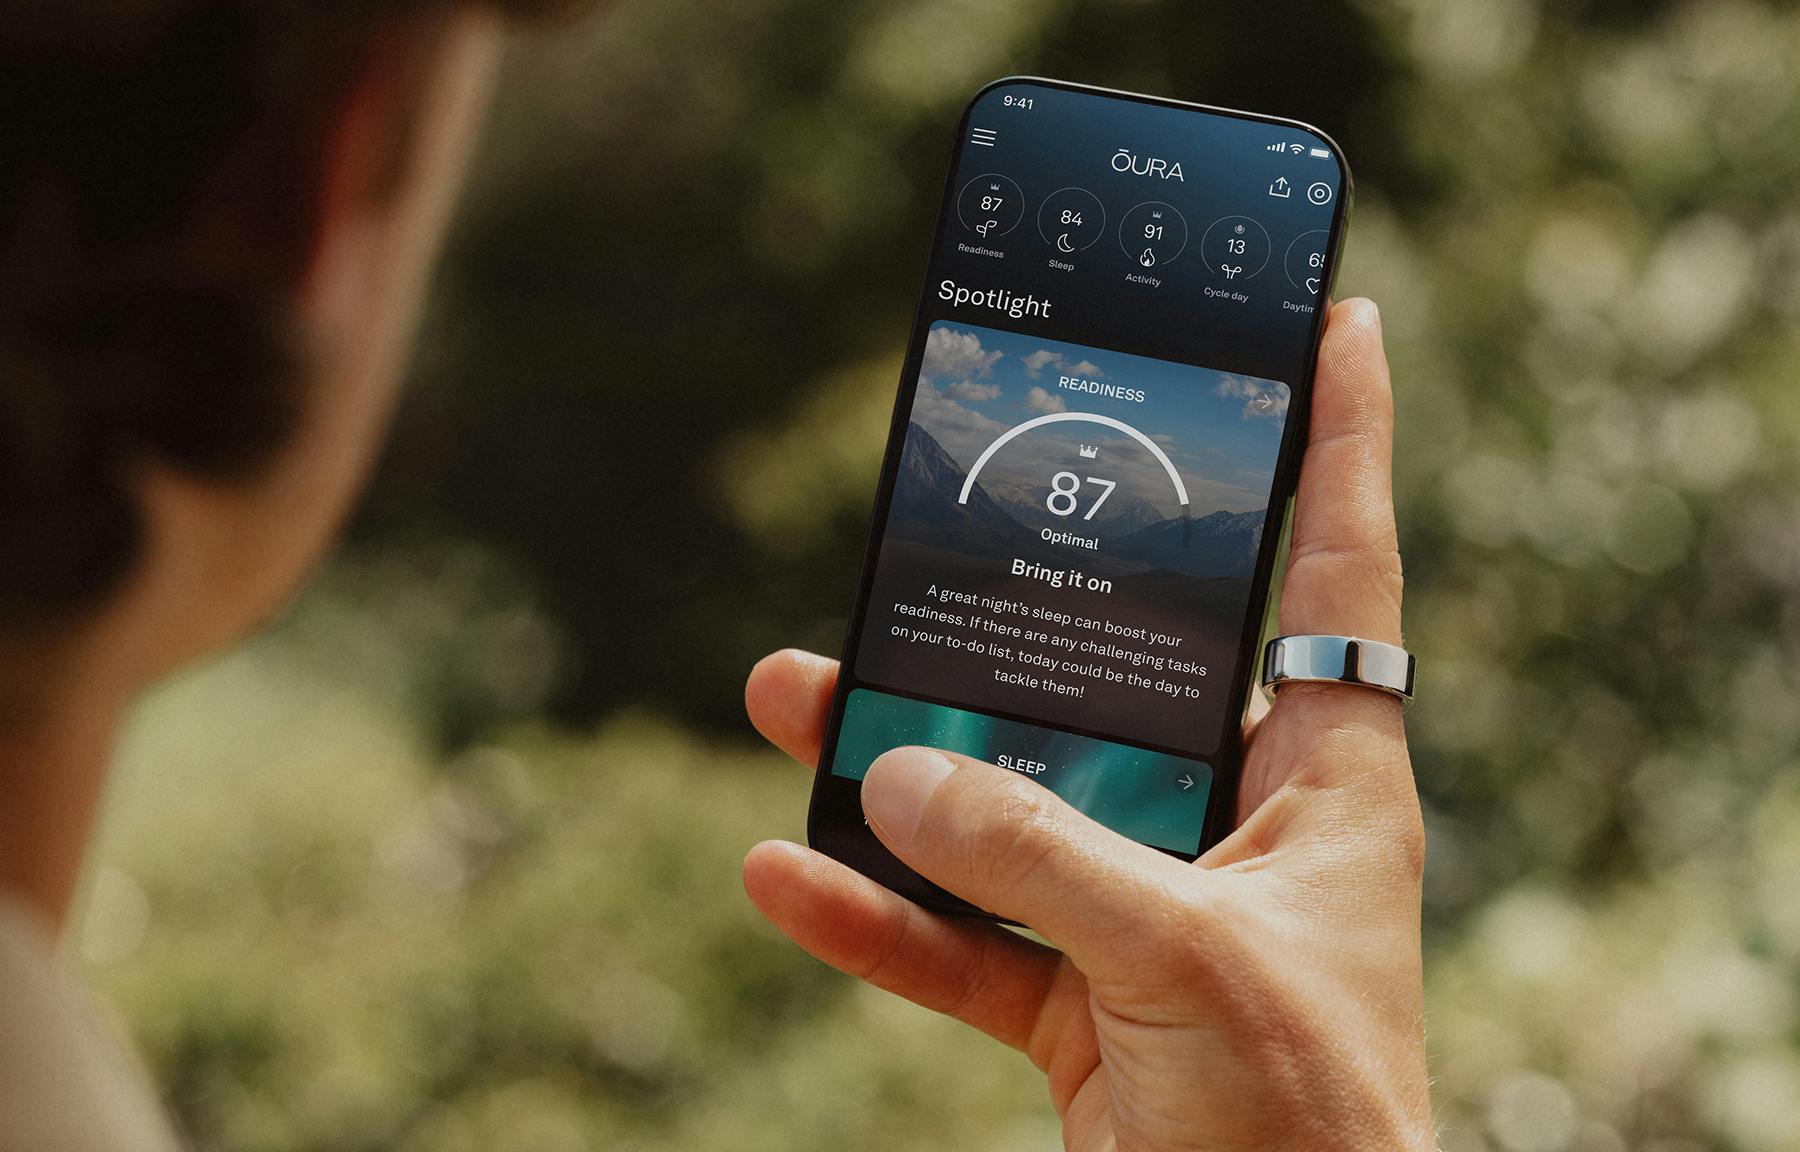
At Oura, we love celebrating our community’s wins as well — the hours we slept, steps we took, and crowns we achieved. If you’re an Oura member, you’ll discover your own personal data story in your Year in Review, now available in the Oura App.
| Member Tip: Members who have at least 60 days of data can access their Year in Review in the Oura App Home tab or Reports hub. Celebrate your successes and share your wins on social media! |
Wondering how your stats look relative to other Oura members? We did too, so we analyzed aggregate, anonymized Oura member data* from around the globe to uncover some interesting patterns in the way we slept, moved, and recovered as a community.
1. Where Did Oura Members Sleep the Best?
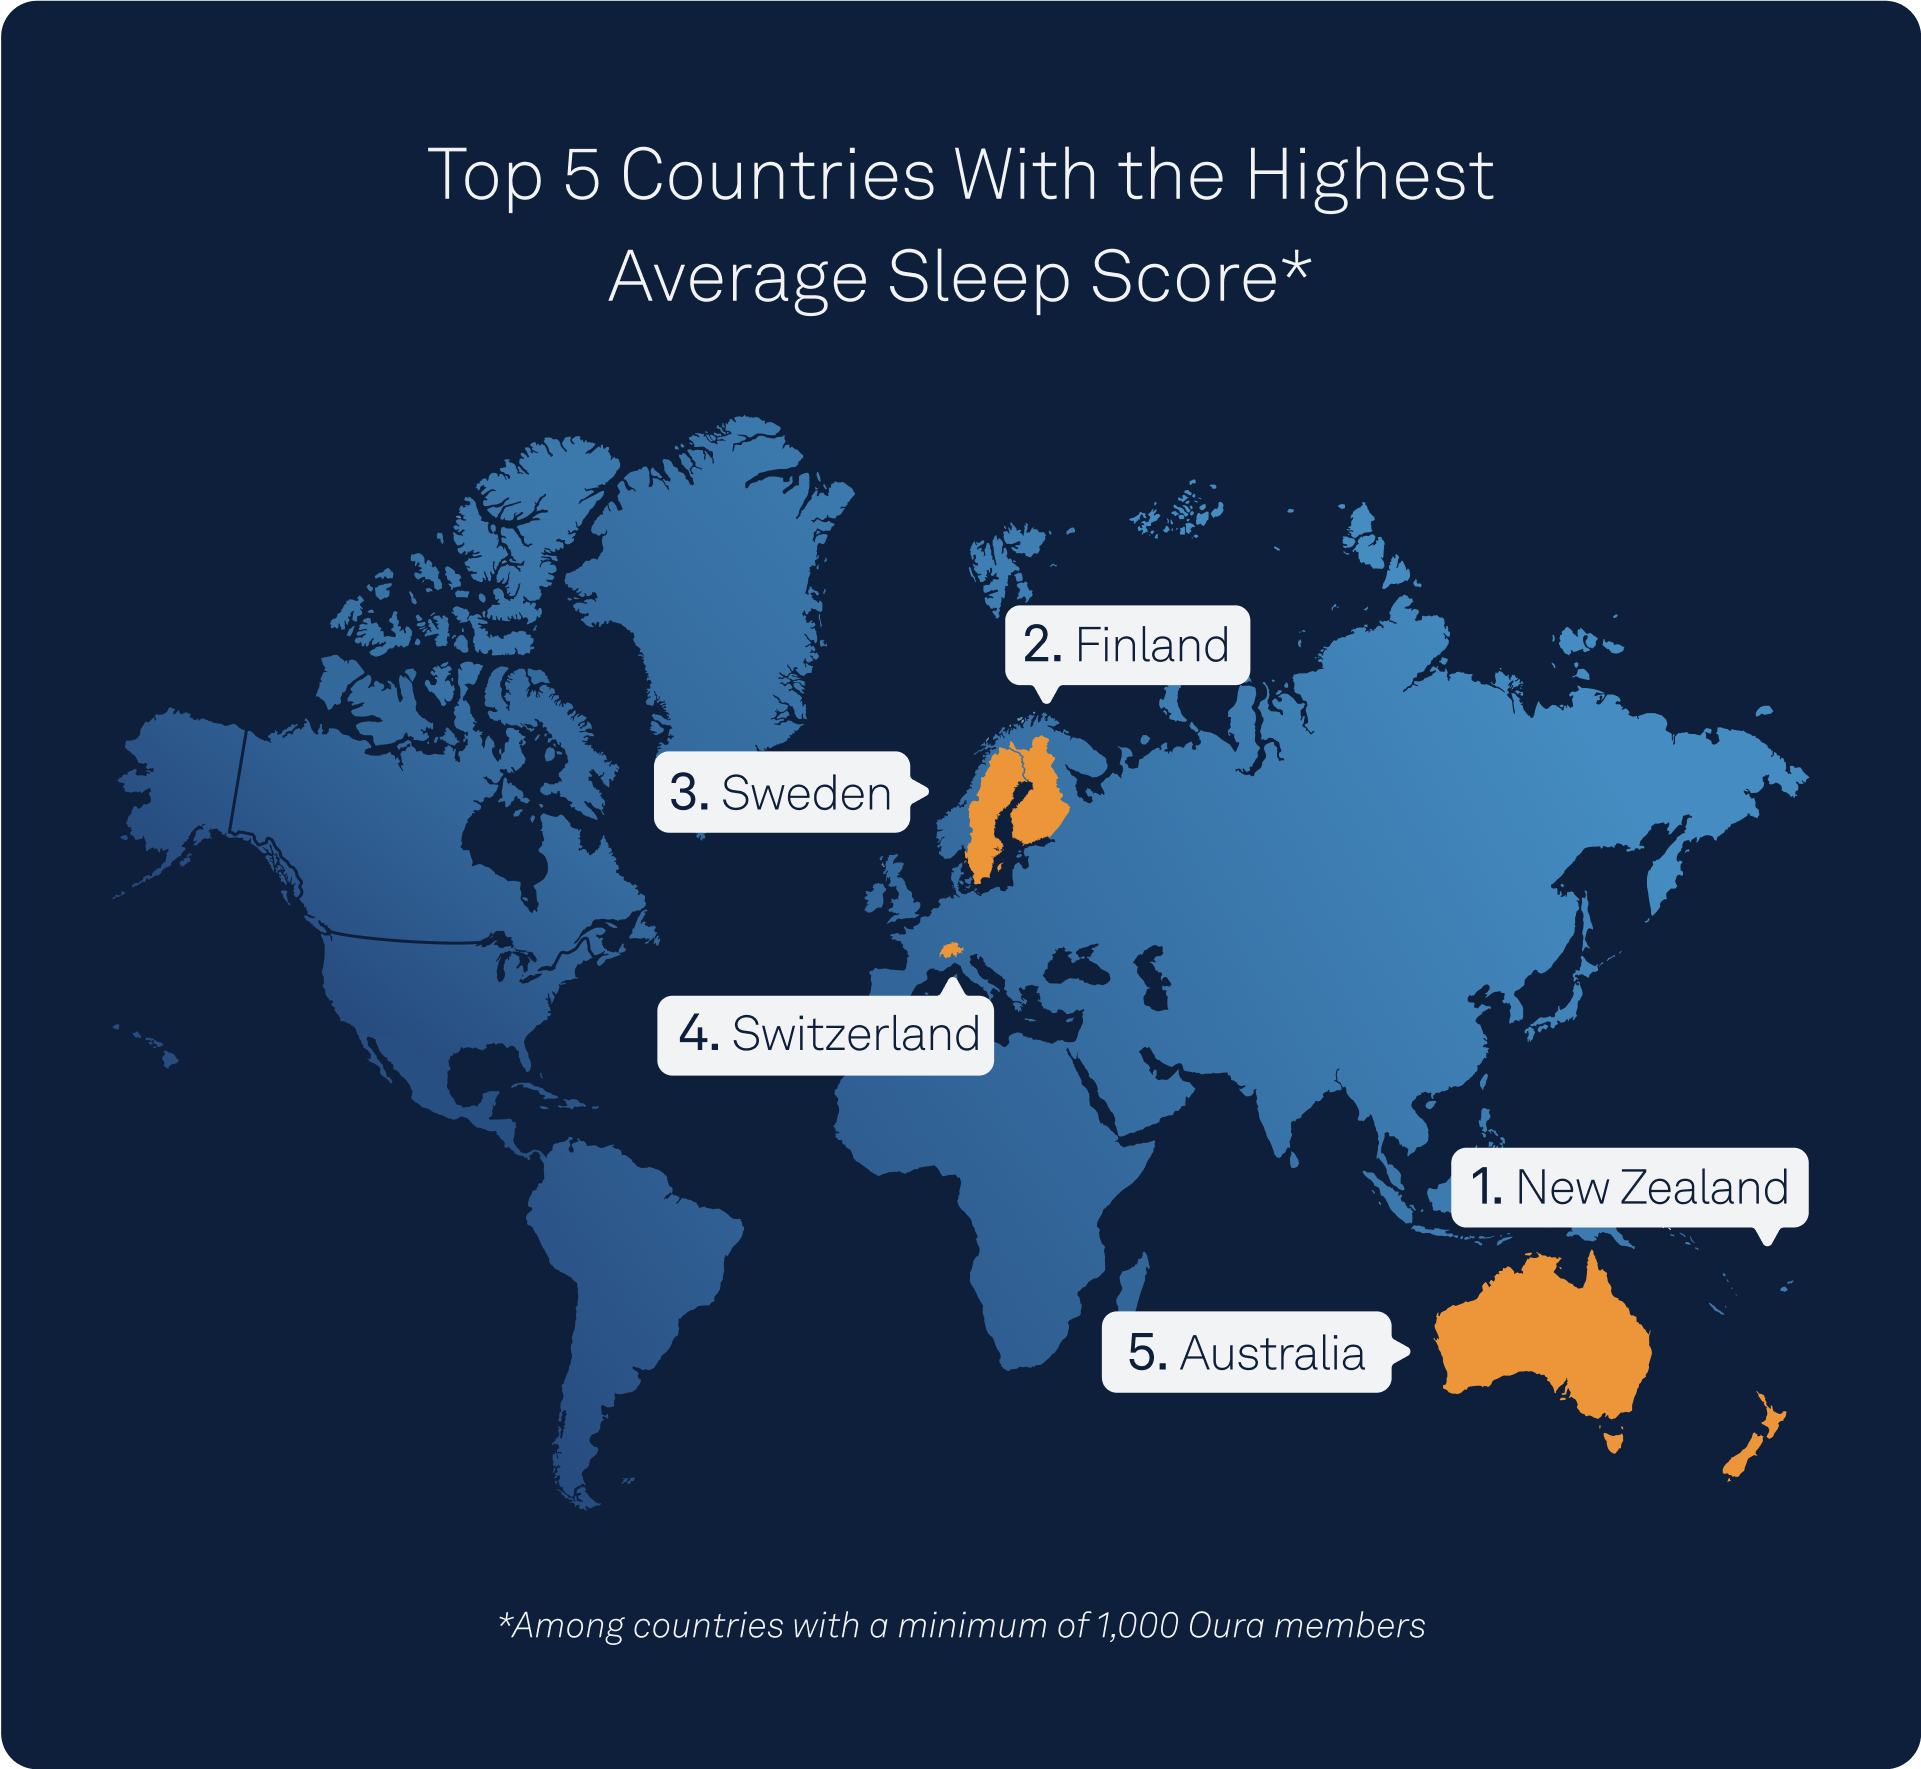
Our Kiwi friends led the way in global Sleep Scores with an impressive average of 78.0. Not far behind, Finland (the birthplace of Oura!) came in second place with an average of 77.9, followed by Sweden with 77.8, Switzerland with 77.4, and Australia with 77.1.
The beautiful Oceanic countries of New Zealand and Australia, as well as the Nordic nations of Finland and Sweden, clearly have their sleep habits dialed in. To improve yours, check out these tips from Oura members to sleep more deeply.
READ MORE: 8 Finnish Secrets to Stay Happy & Healthy All Winter
2. How Many Oura Members Received Each Superlative?
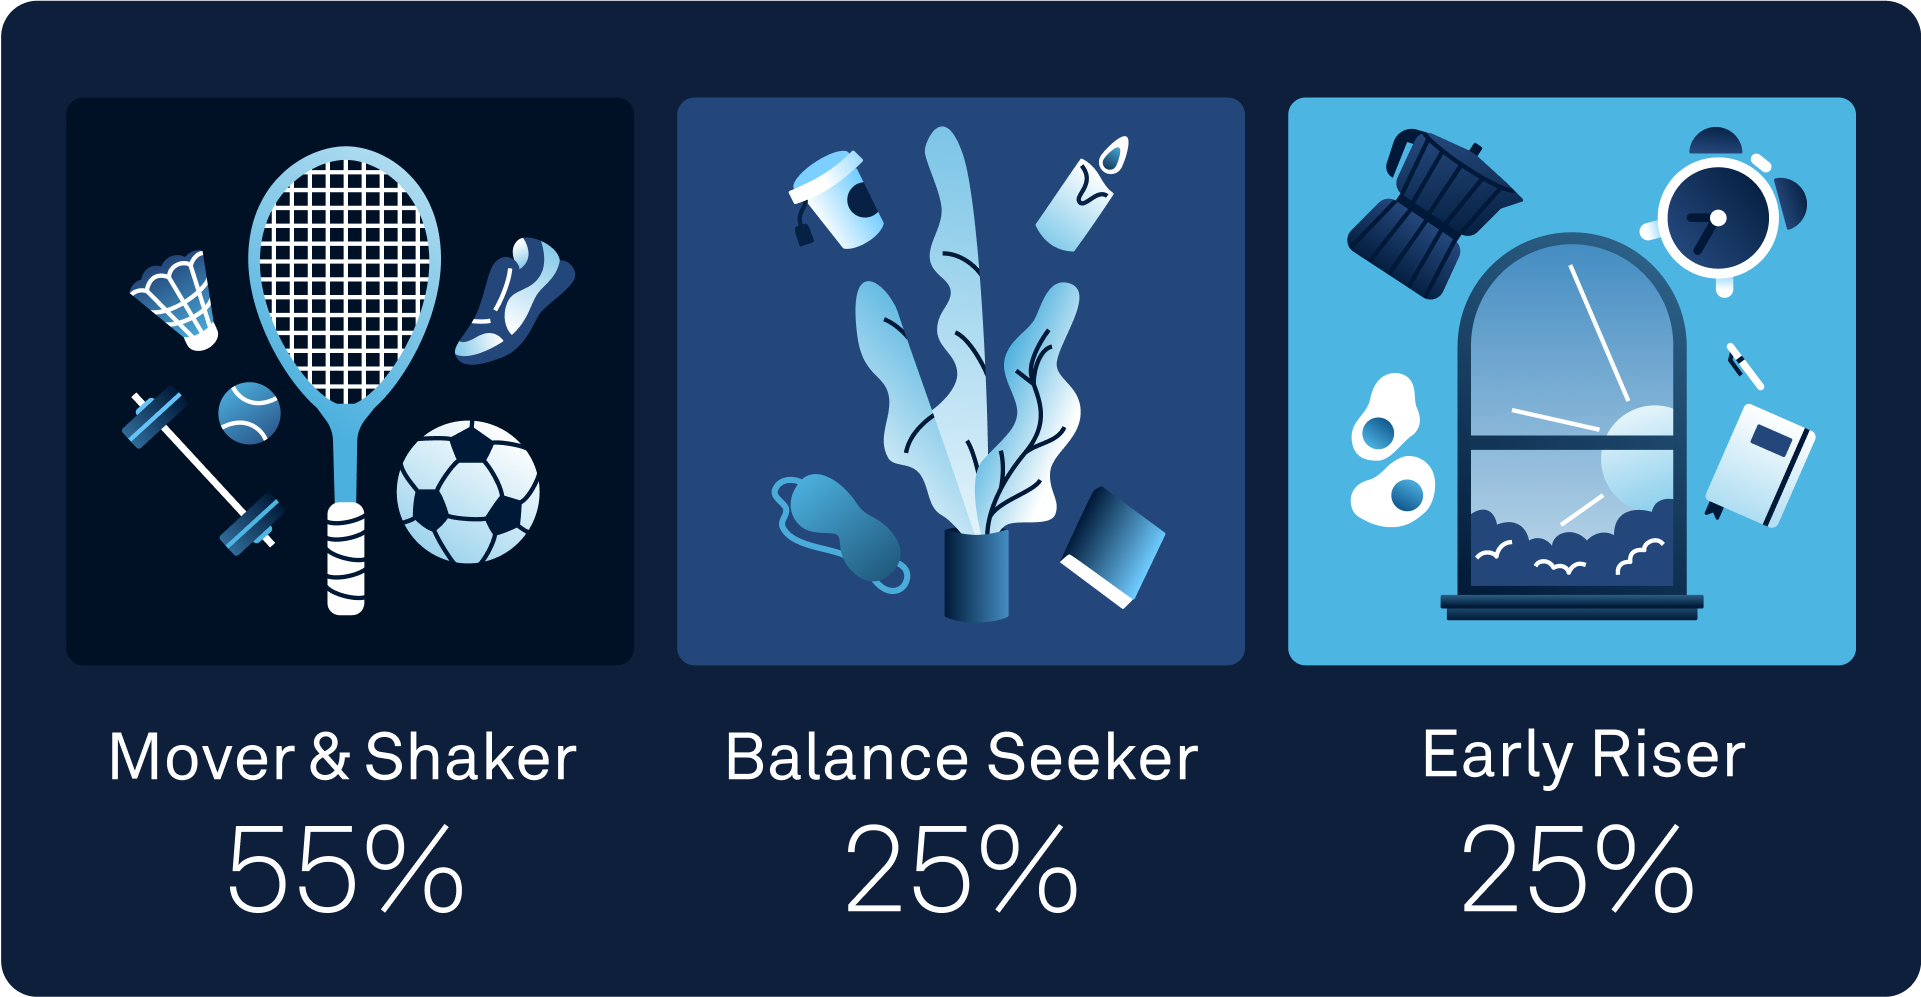
It’s like your high school yearbook — but healthy. In the 2023 Year in Review, Oura members received one of three “superlatives:” Mover & Shaker, Balance Seeker, or Early Riser.
Whether you tried a ton of new activities and sports, found that ever-elusive sense of balance in life, or rose with the morning sunlight, we’re impressed! And for the 25% of our members who are Early Risers, we’d recommend our science-backed guide to creating your ideal daily schedule.
RELATED: What Is Your Chronotype & Why Does It Matter?
3. When Were Oura Members Most & Least Active?
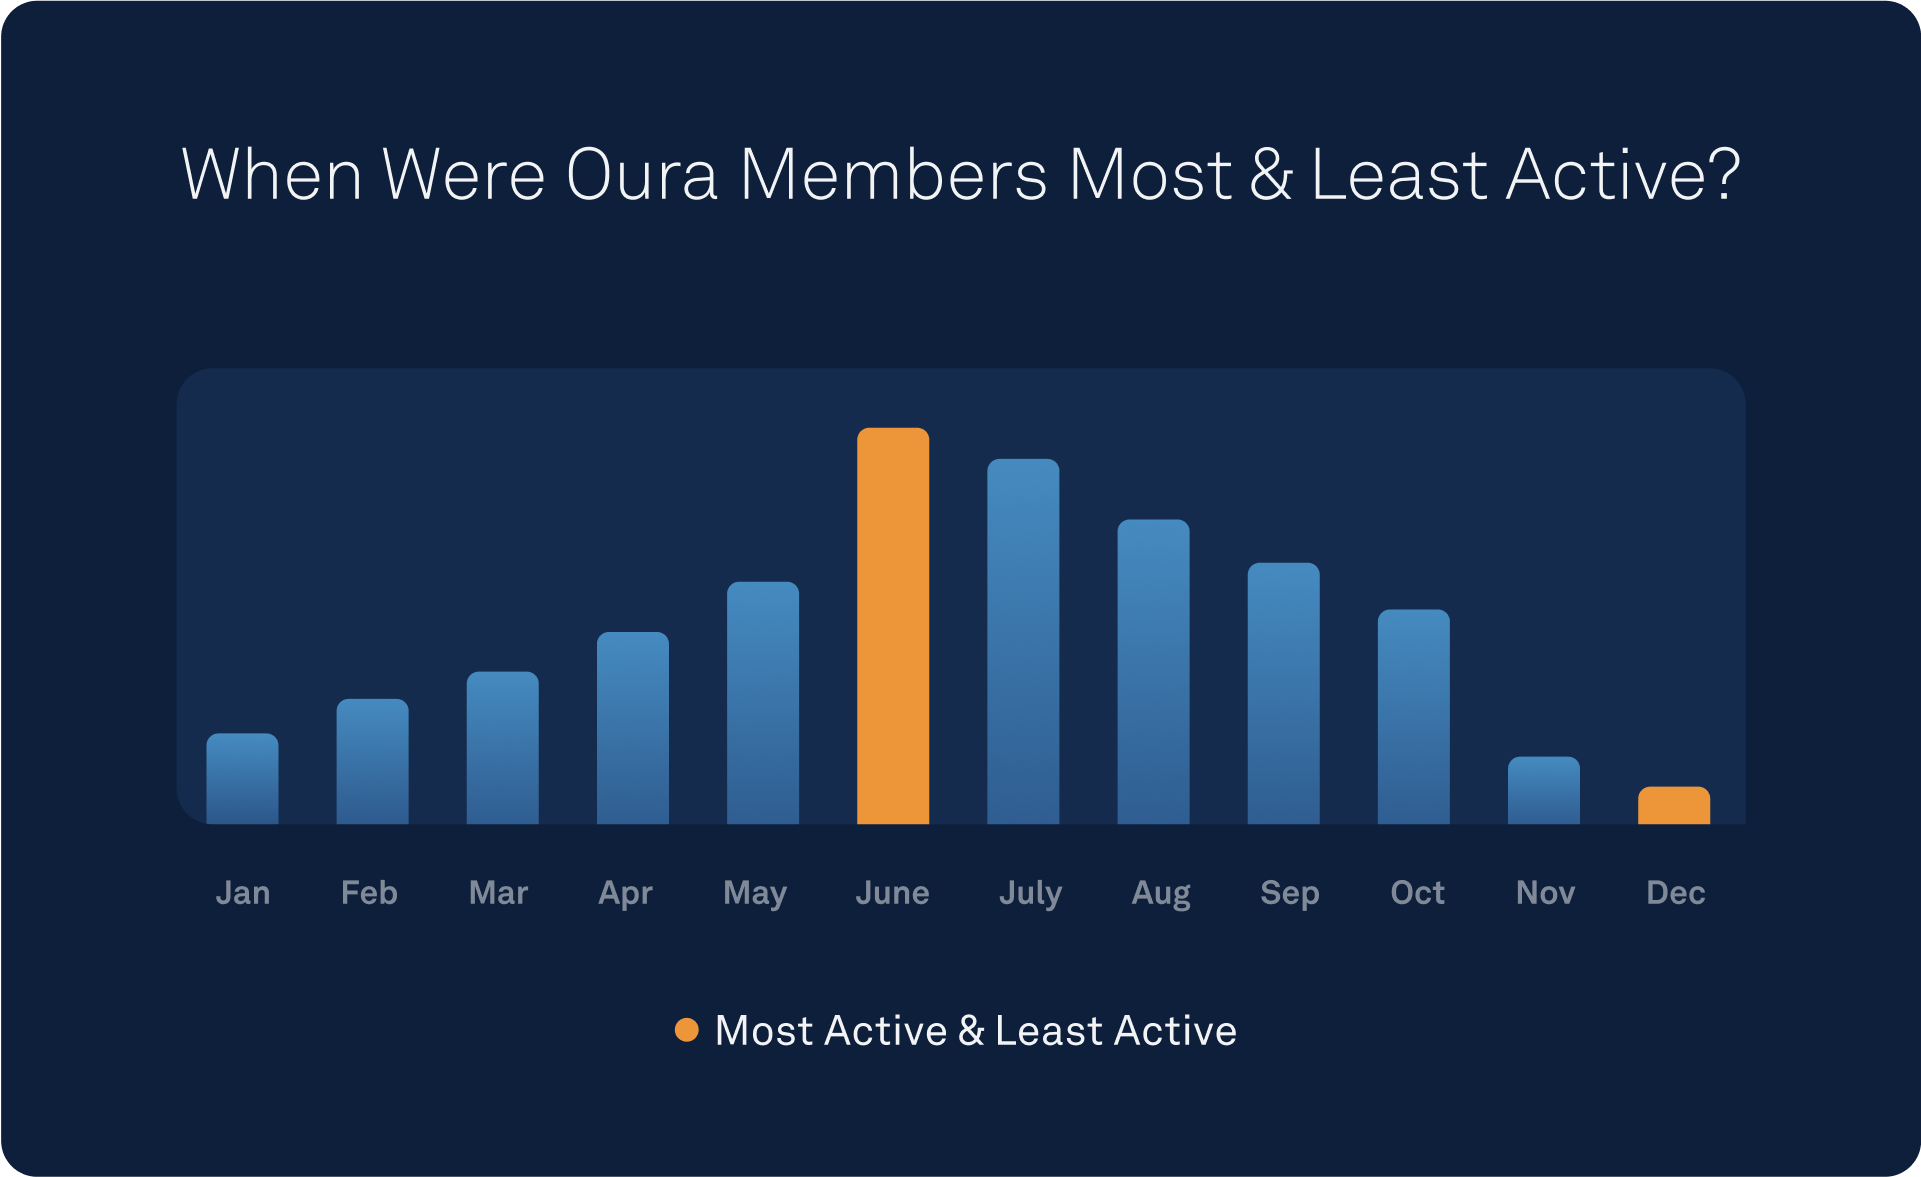
It’s probably no surprise that Oura members move more during the summer months, while activity drops off during the colder, darker days of winter. In fact, it’s a science-backed phenomenon — check out this blog to learn why you sleep more in the winter, and what you can do to up your energy levels.
Interestingly, in last year’s community data analysis, we found that members’ Readiness Scores dropped to their lowest point in June. Our communal high activity levels might be a culprit, as well the warmer weather and busier travel schedules that tend to accompany the summer months (in the northern hemisphere, at least).
RELATED: Defining Low, Medium, and High-Intensity Movement & Using Oura to Track It
4. When Did Oura Members Sleep the Best & Worst?
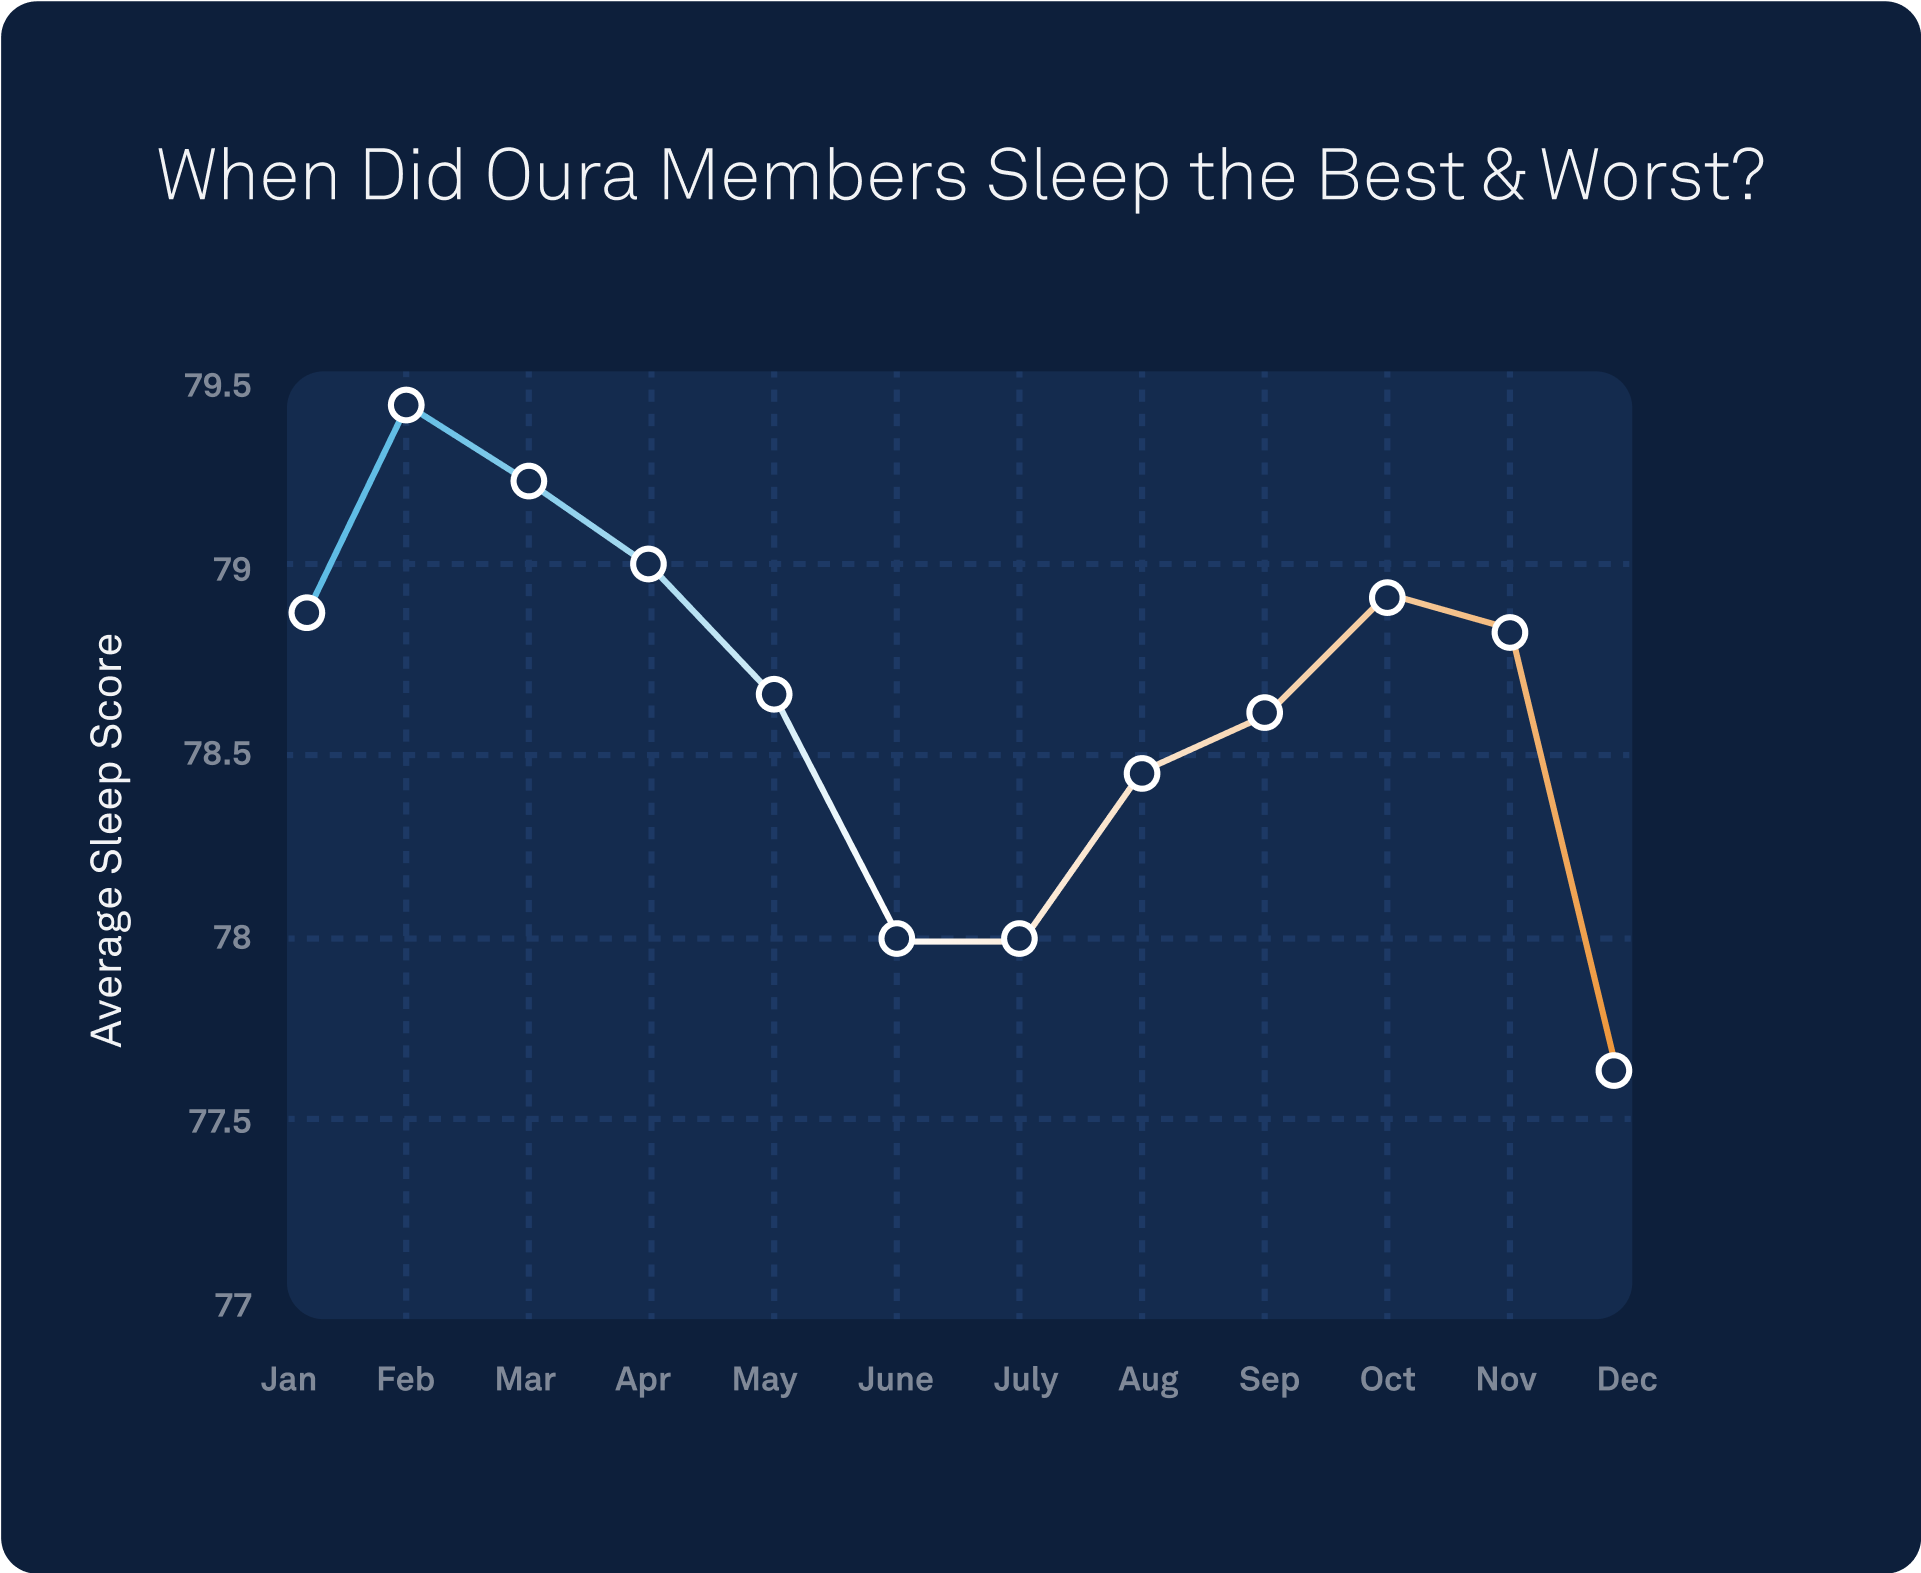
Members’ average Sleep Scores peaked in February, gradually dropping in June and July, before rising again in August, September, and October. We based December data on 2022, but expect this year’s data to follow a similar pattern.
The busy schedules and warmer days of the summer may be to blame, as well as the hectic holiday season in December. To learn how to combat seasonal sleep issues, head to this blog.
READ MORE: Find a Healthy Balance Over the Holidays
5. How Do Female & Male Oura Members’ Sleep Patterns Compare?
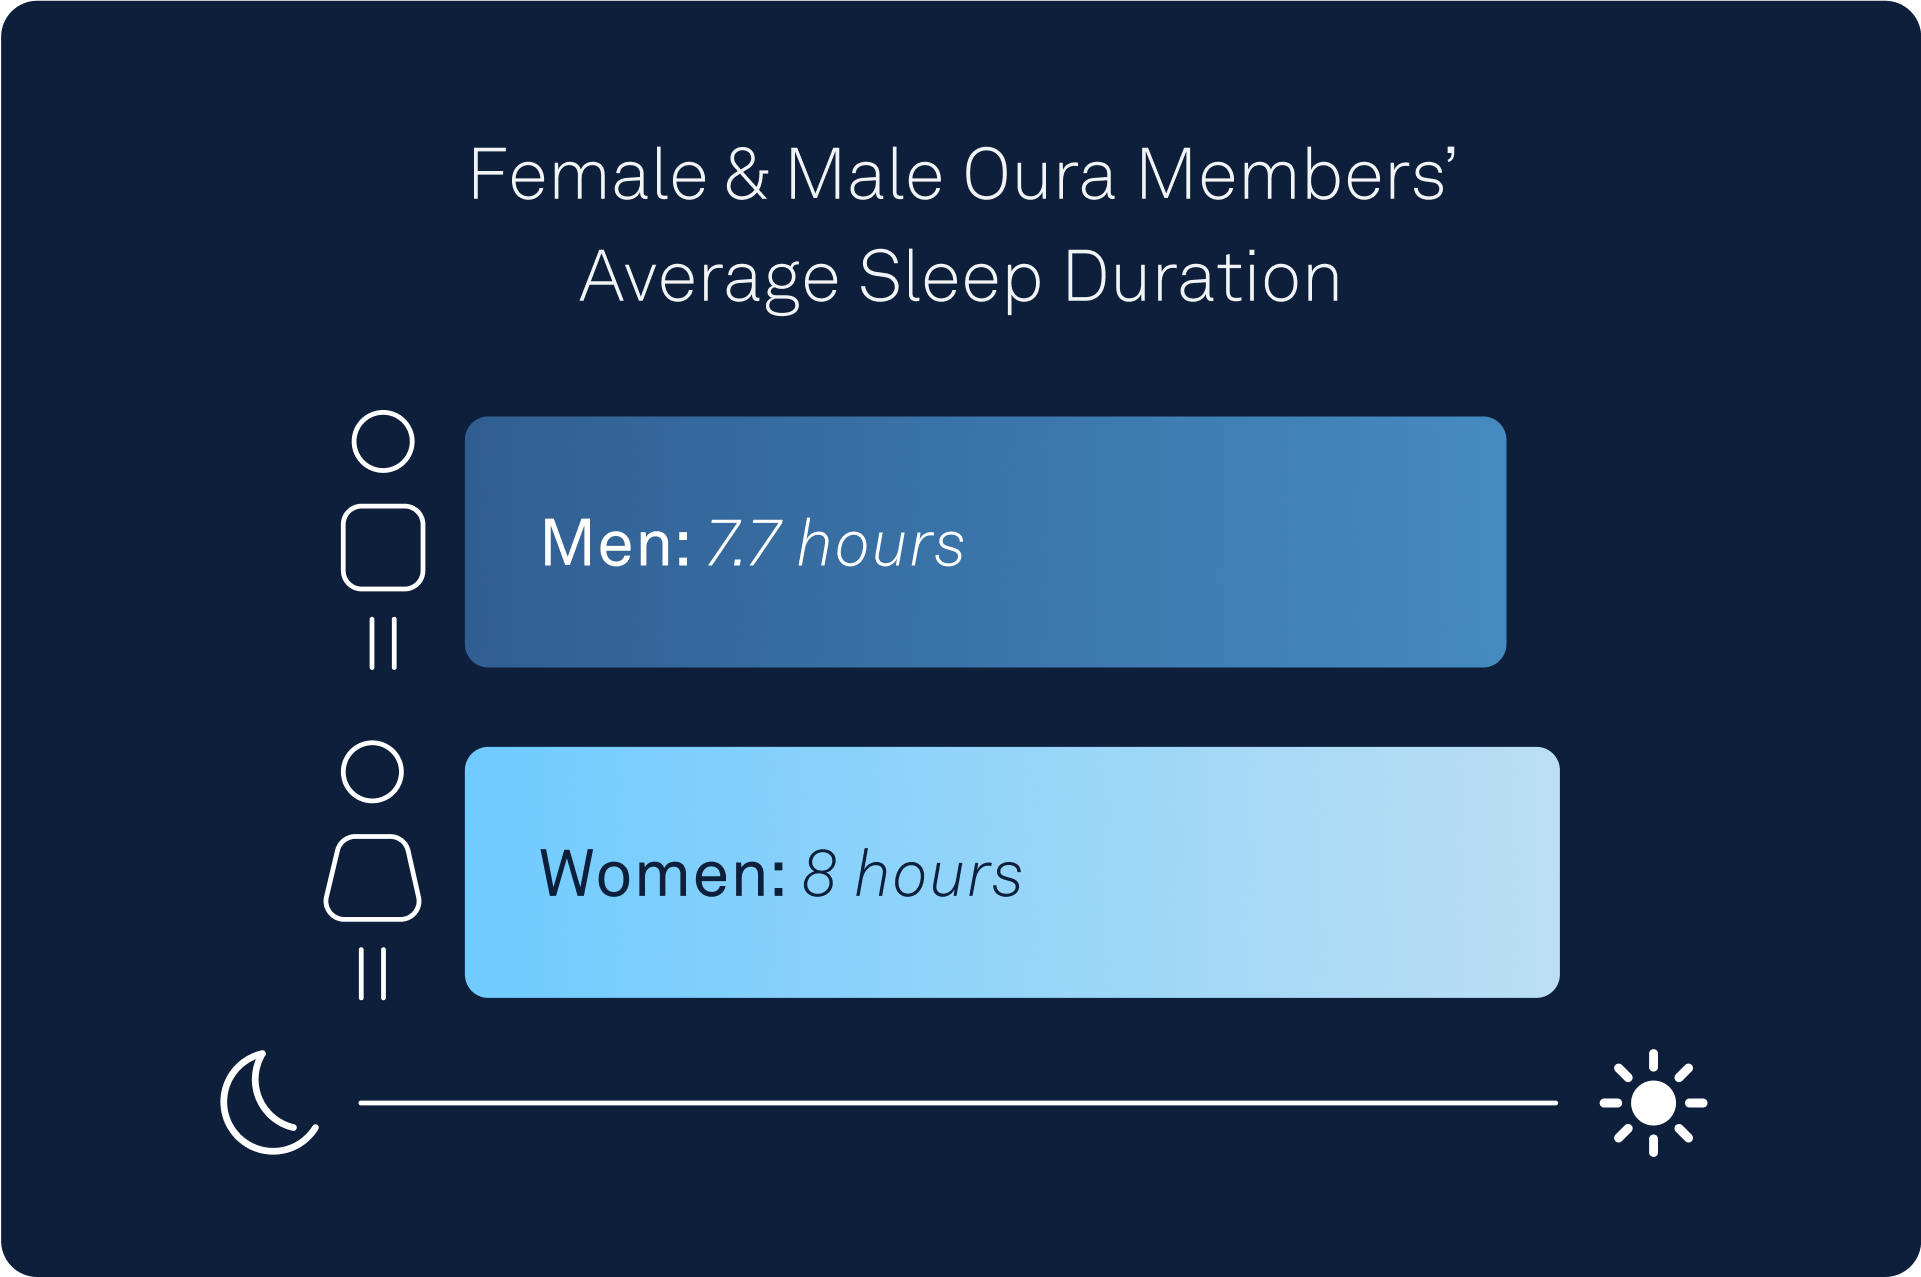
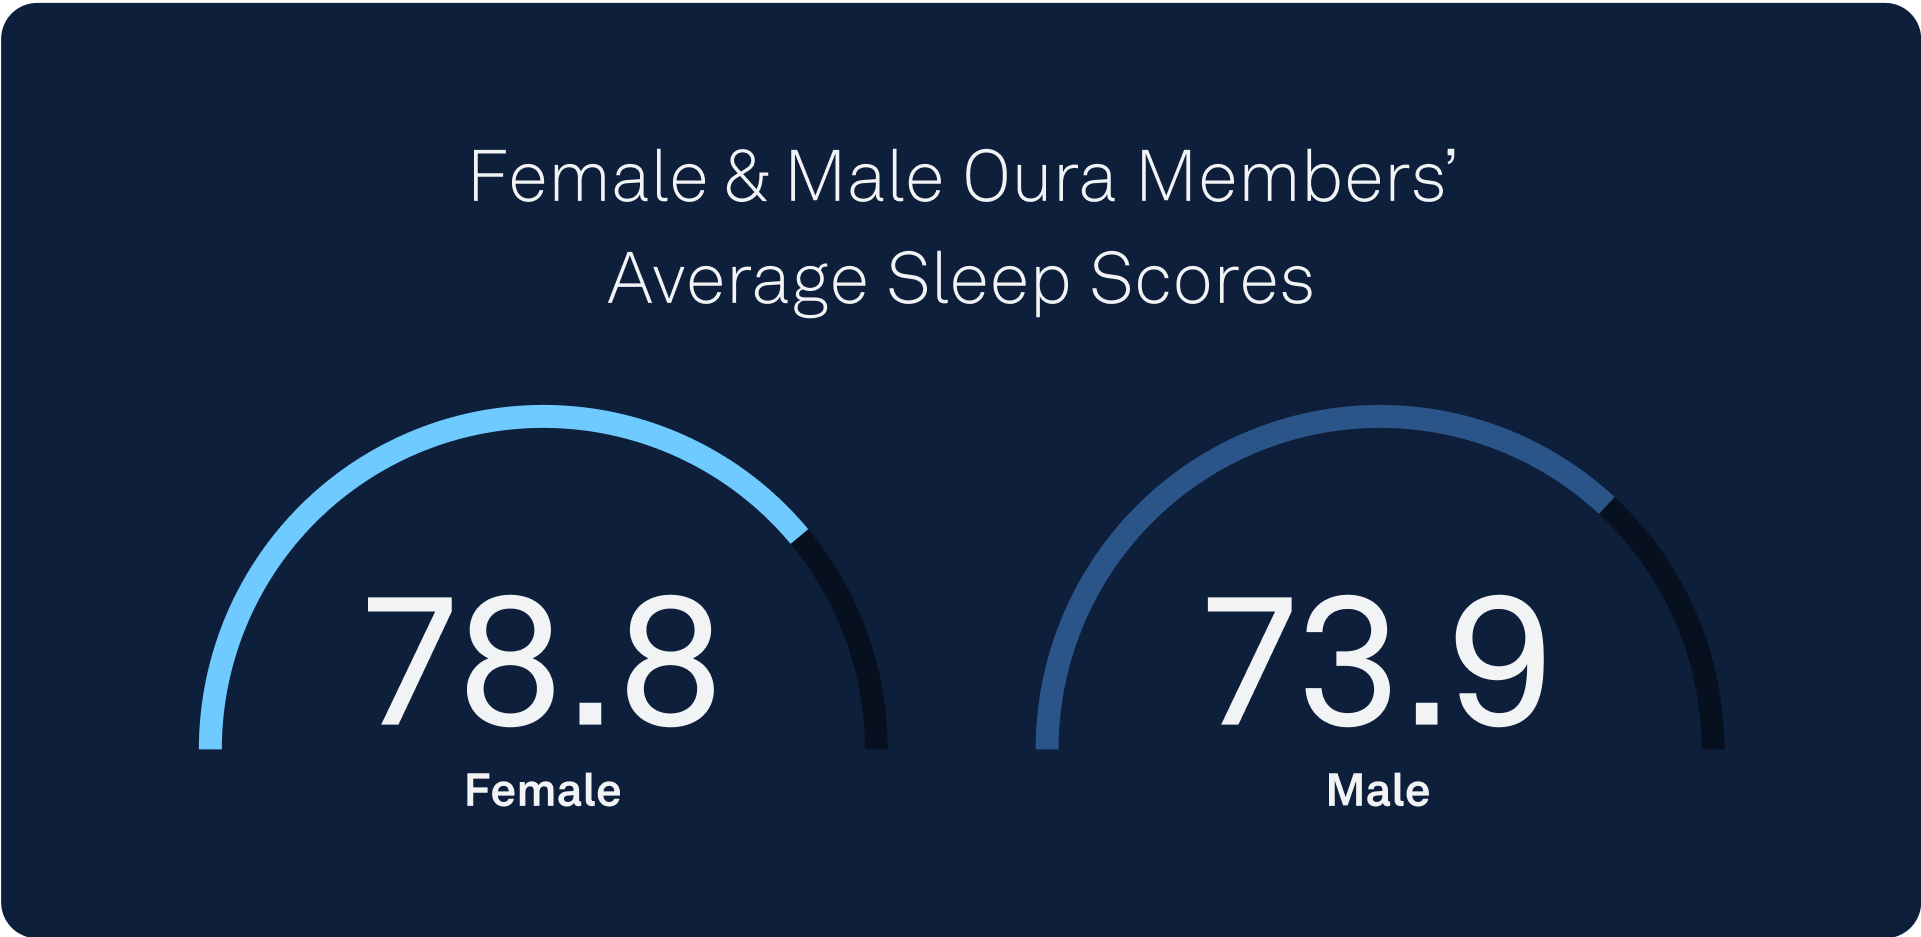
Research — and Oura member data — confirms: Women get more ZZZs than men. Female Oura members slept an average of 8 hours, while male members got 7.7 hours of shuteye.** Women’s Sleep Scores also topped men’s, with an average of 78.8 for women and 73.9 for men.
LEARN MORE: Male and Female Sleep Patterns: How Do They Differ and Why?
*Based on data from January 1, 2023 through early November 2023
**”Female and male are options chosen by members when asked about biological sex at birth.