


Oura is always working to improve the experience for our users by continually prioritizing accuracy. Most recently, our Data Science Team launched an initiative to put our respiratory rate metric to the test.
In an analysis that compared Oura’s photoplethysmography (PPG)-derived respiratory rate metric to an electrocardiogram (ECG)-derived method, the Oura Ring was shown to be accurate within 1 breath per minute across the entire night when compared to medical-grade research tools.
What Are The Details?
Oura continually invests in research, partnering with scientists and universities, so that signals like respiratory rate can be increasingly accurate and trustworthy.
Oura’s Data Science Team partnered with researchers at the National University of Singapore and Duke-NUS Medical School as part of their rigorous Need For Sleep Study, which Oura used for validation.
The Oura Ring uses a well-established method of using fluctuations in your heart rate to estimate your respiratory rate. When you breathe in, your heart rate increases. When you breathe out, your heart rate slows down. You can read more about this method here.
To validate these estimates, the Data Science Team compared Oura’s PPG-derived metric to data in which the heart’s electrical activity was measured directly via electrocardiogram (ECG). Because respiration is difficult to directly measure without invasive or intrusive sensors, ECG-derived respiratory rate is a well-established and convenient proxy that can achieve a high level of accuracy.1
In this study, 43 healthy, young adults underwent a fixed schedule of 2 nights of normal sleep followed by 5 nights of sleep deprivation while wearing an Oura Ring. On one night per individual, an ECG was also worn.
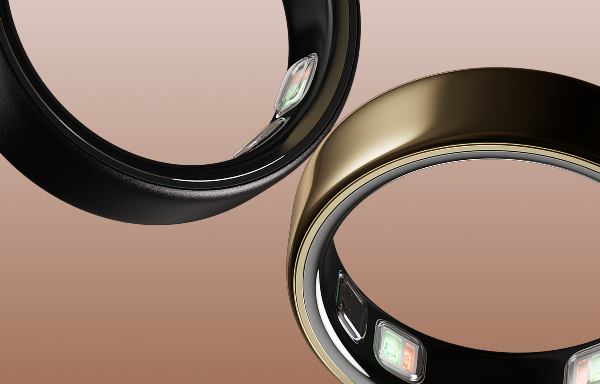
Oura collects superior PPG data that is well-suited for deeper analysis given the high quality signal from using infrared rather than the green light LEDs and its ability to read more directly from arteries in the finger rather than surface capillaries on the wrist.
What Were The Results?
After analyzing the data, the Oura Ring was shown to be:
- A valid tool for measuring average nighttime respiratory rate, on par with ECG
- Accurate within less than 1 breath per minute across the entire night
Let’s dig into the findings.
Oura’s Respiratory Rate Is Highly Accurate Across All Participants
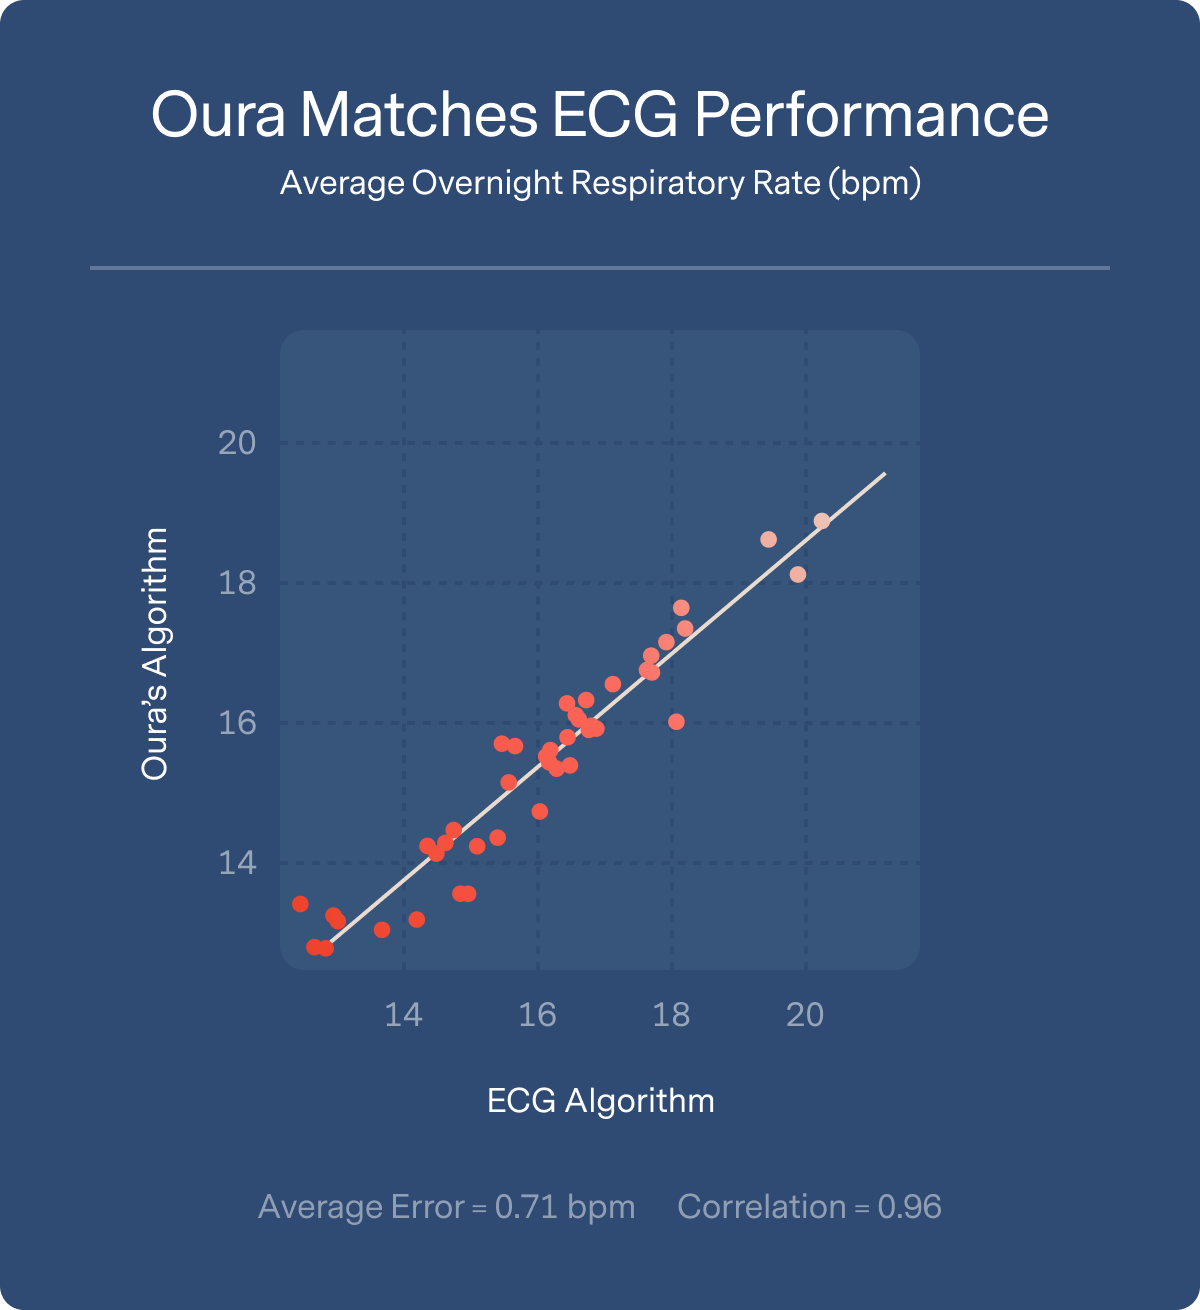
Average overnight respiratory rate from the Oura Ring was compared against an ECG-derived respiratory metric across all 43 participants. The result was an average error of less than 1 breath per minute (0.71 bpm) over the course of the entire night. This held true for individuals across the full range of respiratory rates from high (>20) to low (<14).
Here’s what that comparison of ECG to Oura performance looks like in the raw data:
Oura’s Respiratory Rate Stays Accurate Throughout The Night
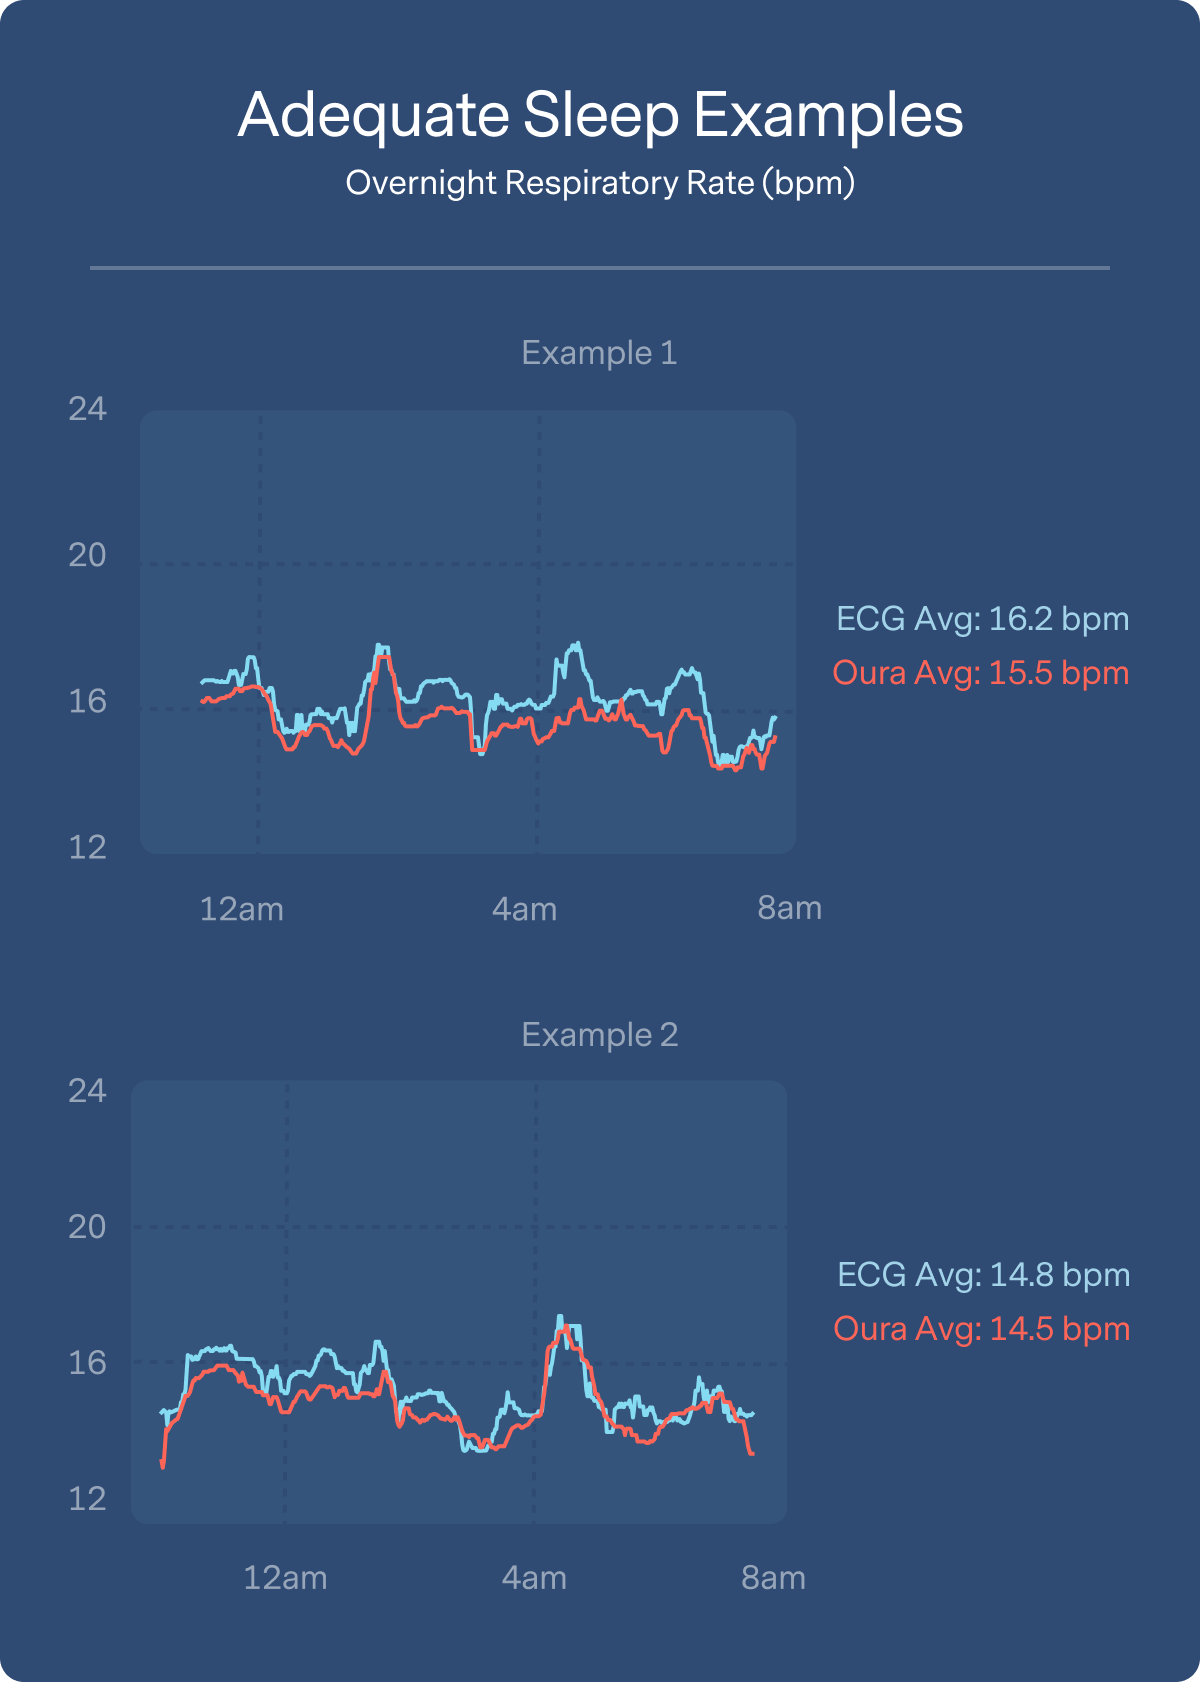
Although Oura only reports a single average respiratory rate value across your sleep within the app, it samples data throughout the night. Analysis reveals how closely that data tracks with ECG estimates across all of the measurement points in a single sleep.
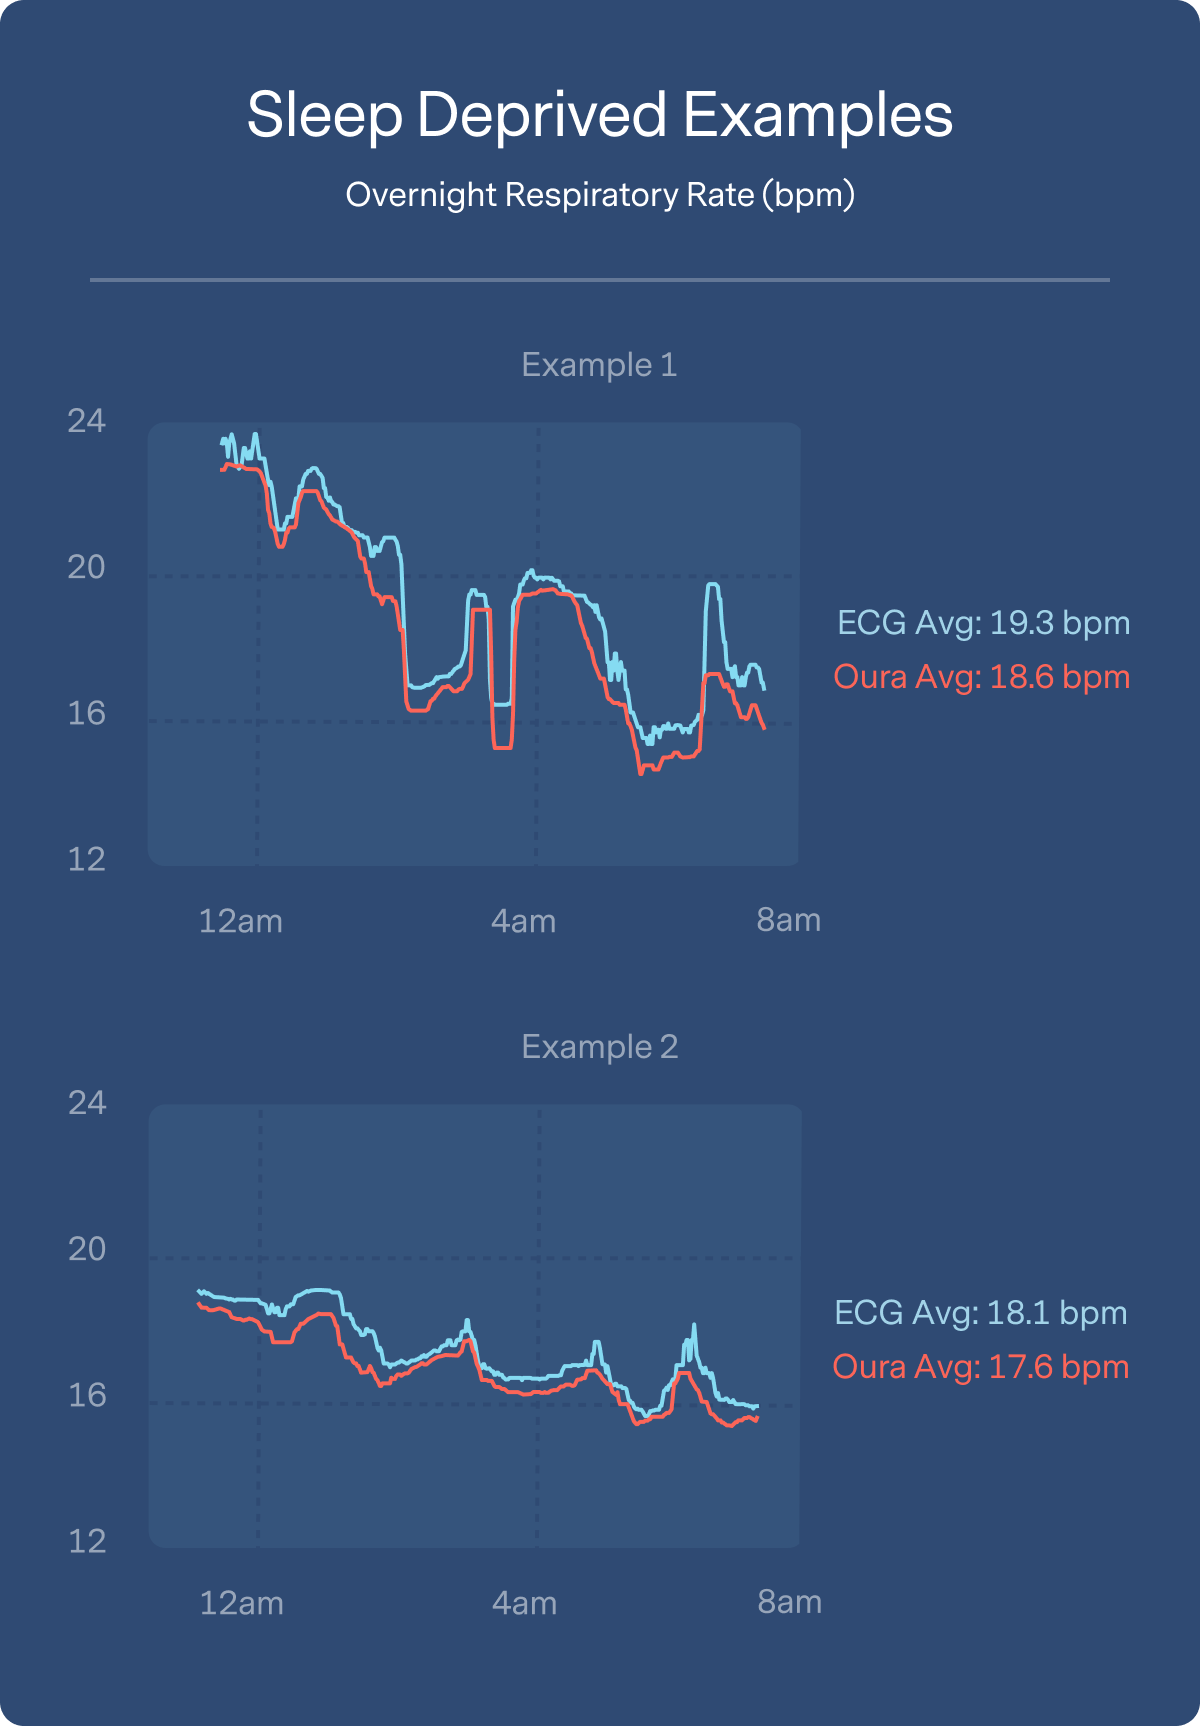
Below you can see Oura’s performance compared to ECG across four example participants — two who had adequate sleep and two who were sleep deprived. The figure below reveals how similarly ECG and Oura track respiration changes both as an average over the whole night (similar to what you see in the Oura app), as well as across every data point traced across the night.
Oura’s Respiratory Rate Detects Signatures of Sleep Deprivation
Sleep deprivation is known to have deleterious effects on your body, forcing it to work harder overnight to recover.2,3 Because this study involved periods of regular sleep as well as mild sleep deprivation (intended to mirror the lifestyle of students who study late and wake up early for school), our Data Science Team was able to analyze the difference.
Results show that even in this healthy, adolescent group of participants (15-19 years), a modest sleep restriction from roughly 9 to 7 hours of sleep starts to show up as strain in an individual’s respiratory rate. Both the ECG-derived respiratory rate and Oura’s respiration metric detected a striking signature, revealing that sleep deprivation appears to lead to elevated respiratory rates at the beginning of the nighttime, with gradual declines (a potential sign of recovery) during sleep.
Here are example trends we see in individuals with sufficient or restricted sleep:

The figure below (n=7: baseline, n=9: fifth night of sleep deprivation; simultaneous ECG and Oura) shows how that average decline in respiratory rate plays out across these participants. At baseline, young and healthy individuals show little change in respiration rate over the course of the night. However, after 5 consecutive nights of even mild sleep deprivation, the participants show significant alterations in respiratory rate – starting high and showing a pattern of decline that indicates recovery over the course of the night.
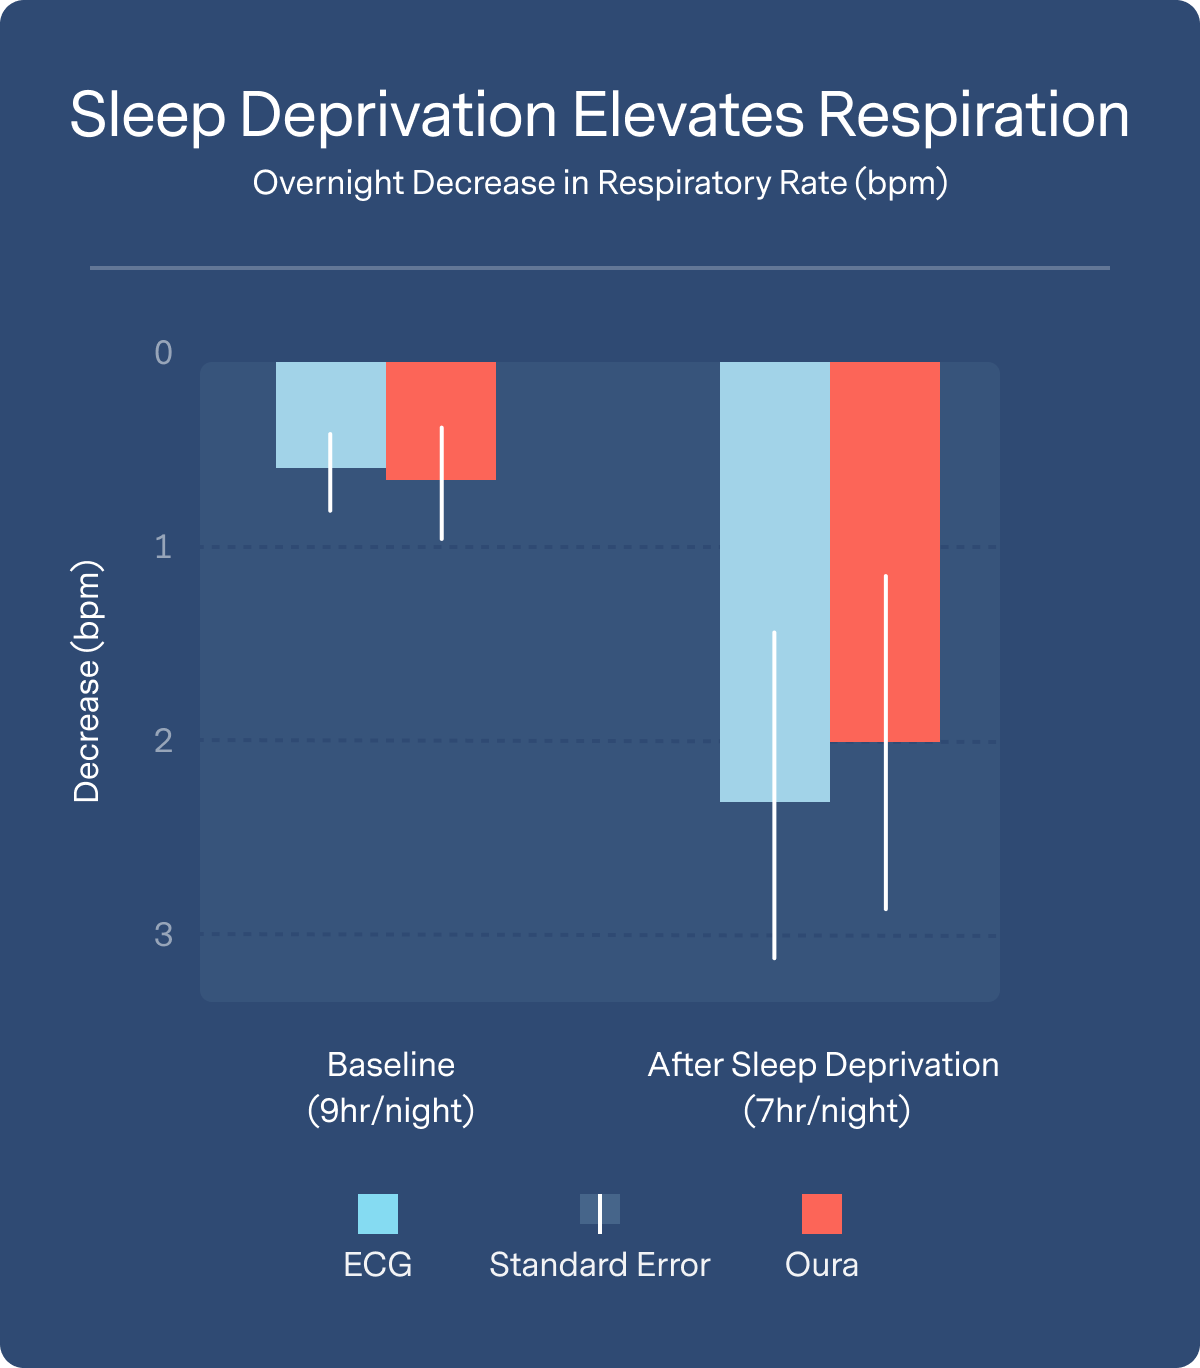
To validate the sensitivity of Oura’s respiration rate metrics relative to those from ECG, we repeated this analysis using only the Oura data (n=38 subjects). There, we observed the same pattern, where sleep deprivation drove a similarly large and statistically significant overnight change in respiratory rate for each user (within-user slope of respiration rate decline during sleep, tested by paired t(18)=4.291, p<0.001, Cohen’s d=0.696). Together these results suggest that Oura’s accurate respiratory rate technology shows promise as a non-invasive tool to further study the impact of sleep on health.
What’s Next?
Your respiratory rate is a key vital sign and a primary indicator of your health and recovery. A healthy individual’s average respiration rate at night may vary between roughly 10-20 breaths per minute.4 Prior scientific research suggests that the ability to easily track subtle changes in respiration rate, especially during sleep, could be helpful for people managing health conditions marked by difficulty breathing, such as asthma,5,6,7 allergies,8 sleep apnea,9 and chronic obstructive pulmonary disease.10,11 With the COVID-19 pandemic, the desire to monitor illness symptoms has increased, and, now more than ever, people are focusing their attention on their respiration.
Oura is committed to continually improving our features for users, and to building science-informed tools you can trust. This is particularly important in circumstances where the stakes are even higher (i.e., monitoring your health). We will continue to innovate and share our learnings with you.
In the meantime, you can read more about how Oura calculates respiratory rate, and what your respiratory rate can reveal.
References
- Charlton, P. H. et al. Breathing Rate Estimation From the Electrocardiogram and Photoplethysmogram: A Review. IEEE Rev. Biomed. Eng. 11, 2–20 (2018).
- Dettoni, J. L. et al. Cardiovascular effects of partial sleep deprivation in healthy volunteers. J. Appl. Physiol. 113, 232–236 (2012).
- Rault, C. et al. Impact of Sleep Deprivation on Respiratory Motor Output and Endurance: A Physiological Study. Am. J. Respir. Crit. Care Med. 201, (2019).
- Russo, M. A., Santarelli, D. M., & O’Rourke, D. (2017). The physiological effects of slow breathing in the healthy human. Breathe, 13(4), 298-309.
- van der Kamp, M. R., Klaver, E. C., Thio, B. J., Driessen, J. M., de Jongh, F. H., Tabak, M., … & Hermens, H. J. (2020). WEARCON: Wearable home monitoring in children with asthma reveals a strong association with hospital based assessment of asthma control.
- Francisco, C. D. O., Bhatawadekar, S. A., Babineau, J., Reid, W. D., & Yadollahi, A. (2018). Effects of physical exercise training on nocturnal symptoms in asthma: Systematic review. PloS one, 13(10), e0204953.
- Raherison, C., Abouelfath, A., Gros, V. L., Taytard, A., & Molimard, M. (2006). Underdiagnosis of nocturnal symptoms in asthma in general practice. Journal of Asthma, 43(3), 199-202.
- Koinis-Mitchell, D., Craig, T., Esteban, C. A., & Klein, R. B. (2012). Sleep and allergic disease: a summary of the literature and future directions for research. Journal of Allergy and Clinical Immunology, 130(6), 1275-1281.
- Bradley, D. (2014). Patterns of breathing dysfunction in hyperventilation and breathing pattern disorders. Recognizing and Treating Breathing Disorders E-Book, 51.
- Lange, P., Marott, J. L., Vestbo, J., & Nordestgaard, B. G. (2014). Prevalence of night-time dyspnoea in COPD and its implications for prognosis. European Respiratory Journal, 43(6), 1590-1598.
- So, J. Y., Duffy, S. P., Markus, H., Rybicki, K., Dormer, J., Zaffaroni, A., … & Criner, A. J. (2018). Daily Measurements of Nocturnal Respiratory Rate Variability May Predict COPD Exacerbations. In C24. NEW TECHNOLOGIES FOR MANAGING COPD (pp. A4550-A4550). American Thoracic Society.