


Respiratory rate can be measured directly by counting the rise and fall of someone’s chest or indirectly by reading it from another signal in your body, like your heart’s activity. A widely used method is deriving respiration from photoplethysmography (PPG), the same light pulses used to measure heart rate in Oura and many hospital devices.
How Does It Work?
Oura derives your respiratory rate exclusively from your nighttime PPG data – the same signal it uses to measure your resting heart rate and heart rate variability.
Nighttime is an ideal time to measure respiration because your body is in a consistent state. During the day, many factors can influence your respiratory rate (e.g., caffeine, emotion, exercise), and it’s even been shown that your rate increases when you know it is being counted.

You can measure respiration in your heartbeat because your heart and lungs are closely connected by a process called respiratory sinus arrhythmia. Although it sounds serious, it’s a completely normal and simple partnership:
- When you breathe in, your heart rate increases.
- When you breathe out, your heart rate slows down.
This helps your body take in oxygen and expel CO2 with as few heartbeats as possible. Because this pattern is predictable, you can measure the variation between heartbeats to determine your respiratory rate.
READ MORE: Understanding Your Respiratory Rate While Sleeping
How Is It Calculated?
Your Oura uses your PPG data to spot your respiratory sinus arrhythmia pattern (your heart speeds up as you breathe in and slows down as you breathe out). Your respiratory rate is calculated based on the number of times this happens in a minute.
Let’s explore how that looks in the data.
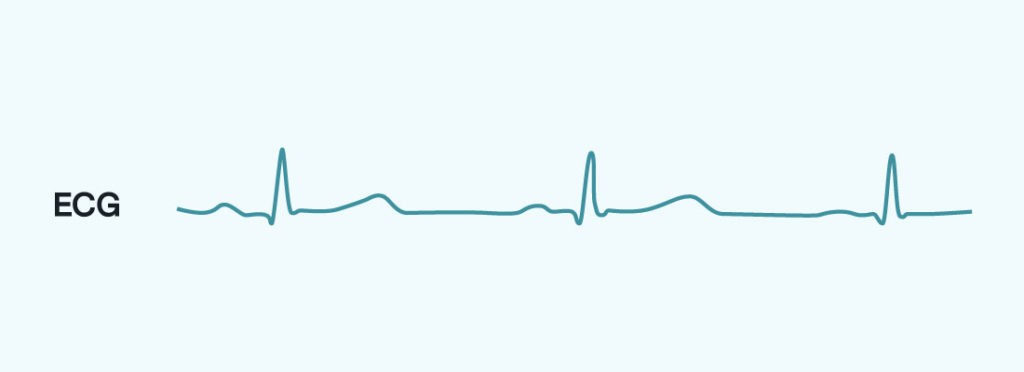
1. Electrical signals power your heart to contract. This is what you see in a classic ECG signal showing a few heartbeats:
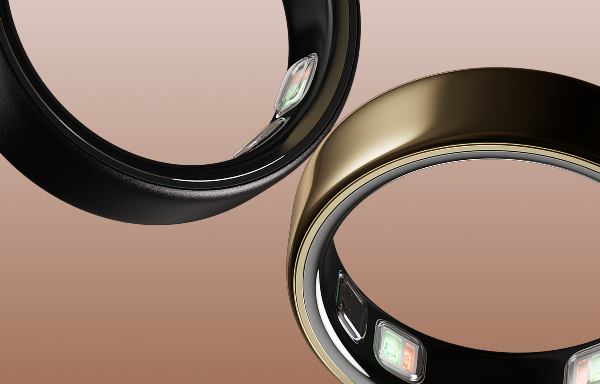
2. Each time your heart beats, it sends a pulse of blood moving out through your arteries, including the ones in your finger where your Oura sits. You can read this activity without an ECG by using a PPG sensor to shine a light onto your skin. As the pulse of movement through your circulatory system changes, the amount of light that is reflected back changes with it, signaling precisely how your heart is beating. Oura uses infrared PPG which penetrates deeper than other green light wearables to measure as close to your arteries as possible.
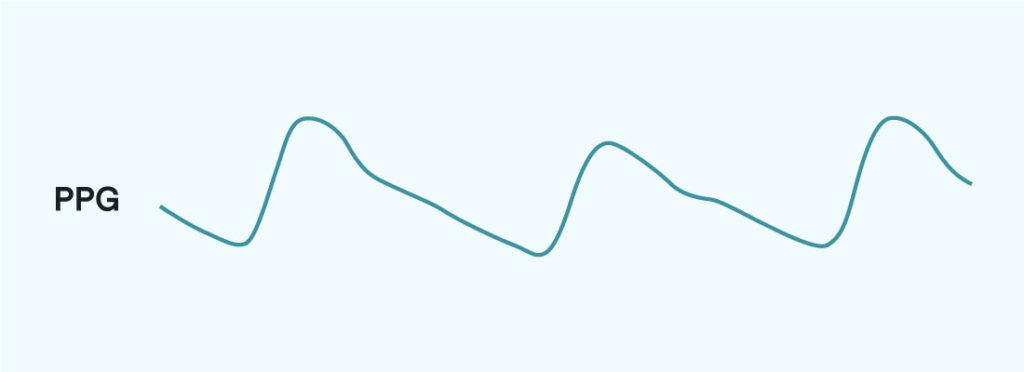
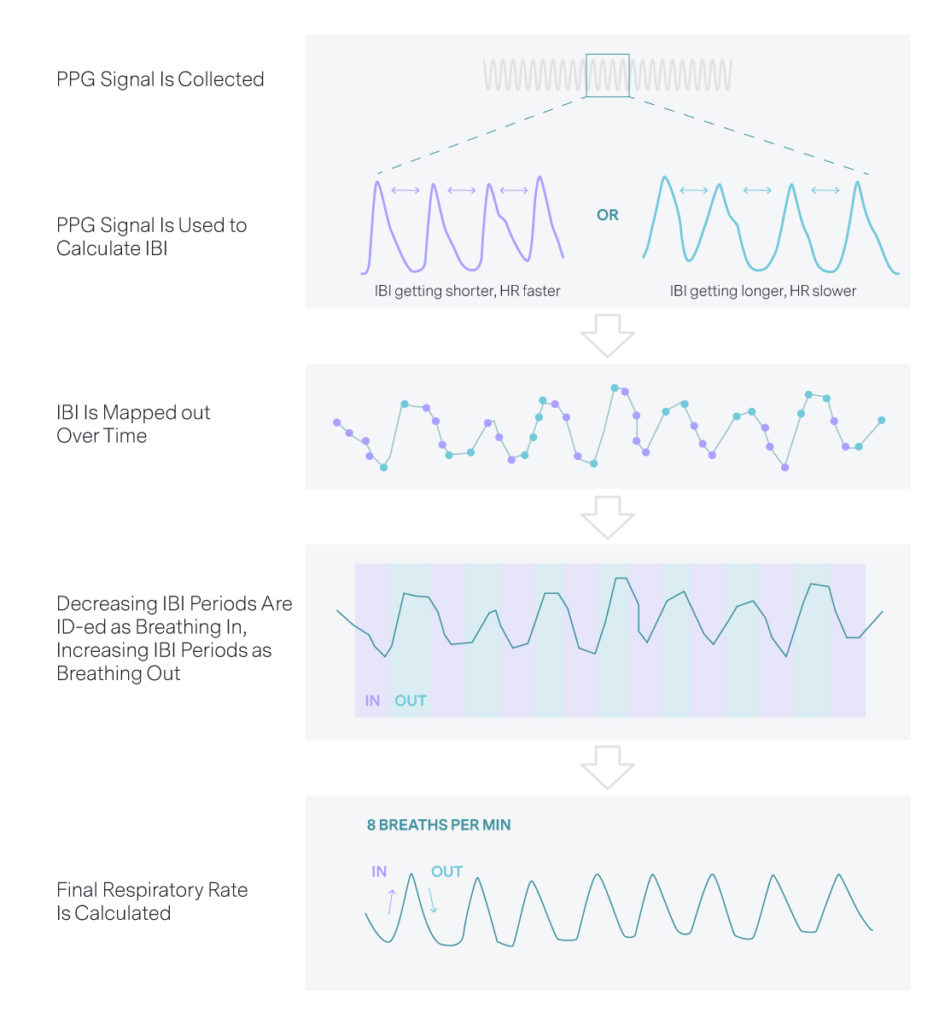
3. In this PPG data, your respiratory sinus arrhythmia pattern can be spotted by identifying when your heart rate speeds up (breathing in) or slows down (breathing out). This is done by calculating the interval between your heart beats, your interbeat intervals (IBI). You can follow that process in-depth with the image below:
READ MORE: What is the Relationship Between Heart Rate and Respiratory Rate?
How To Interpret Your Respiratory Rate
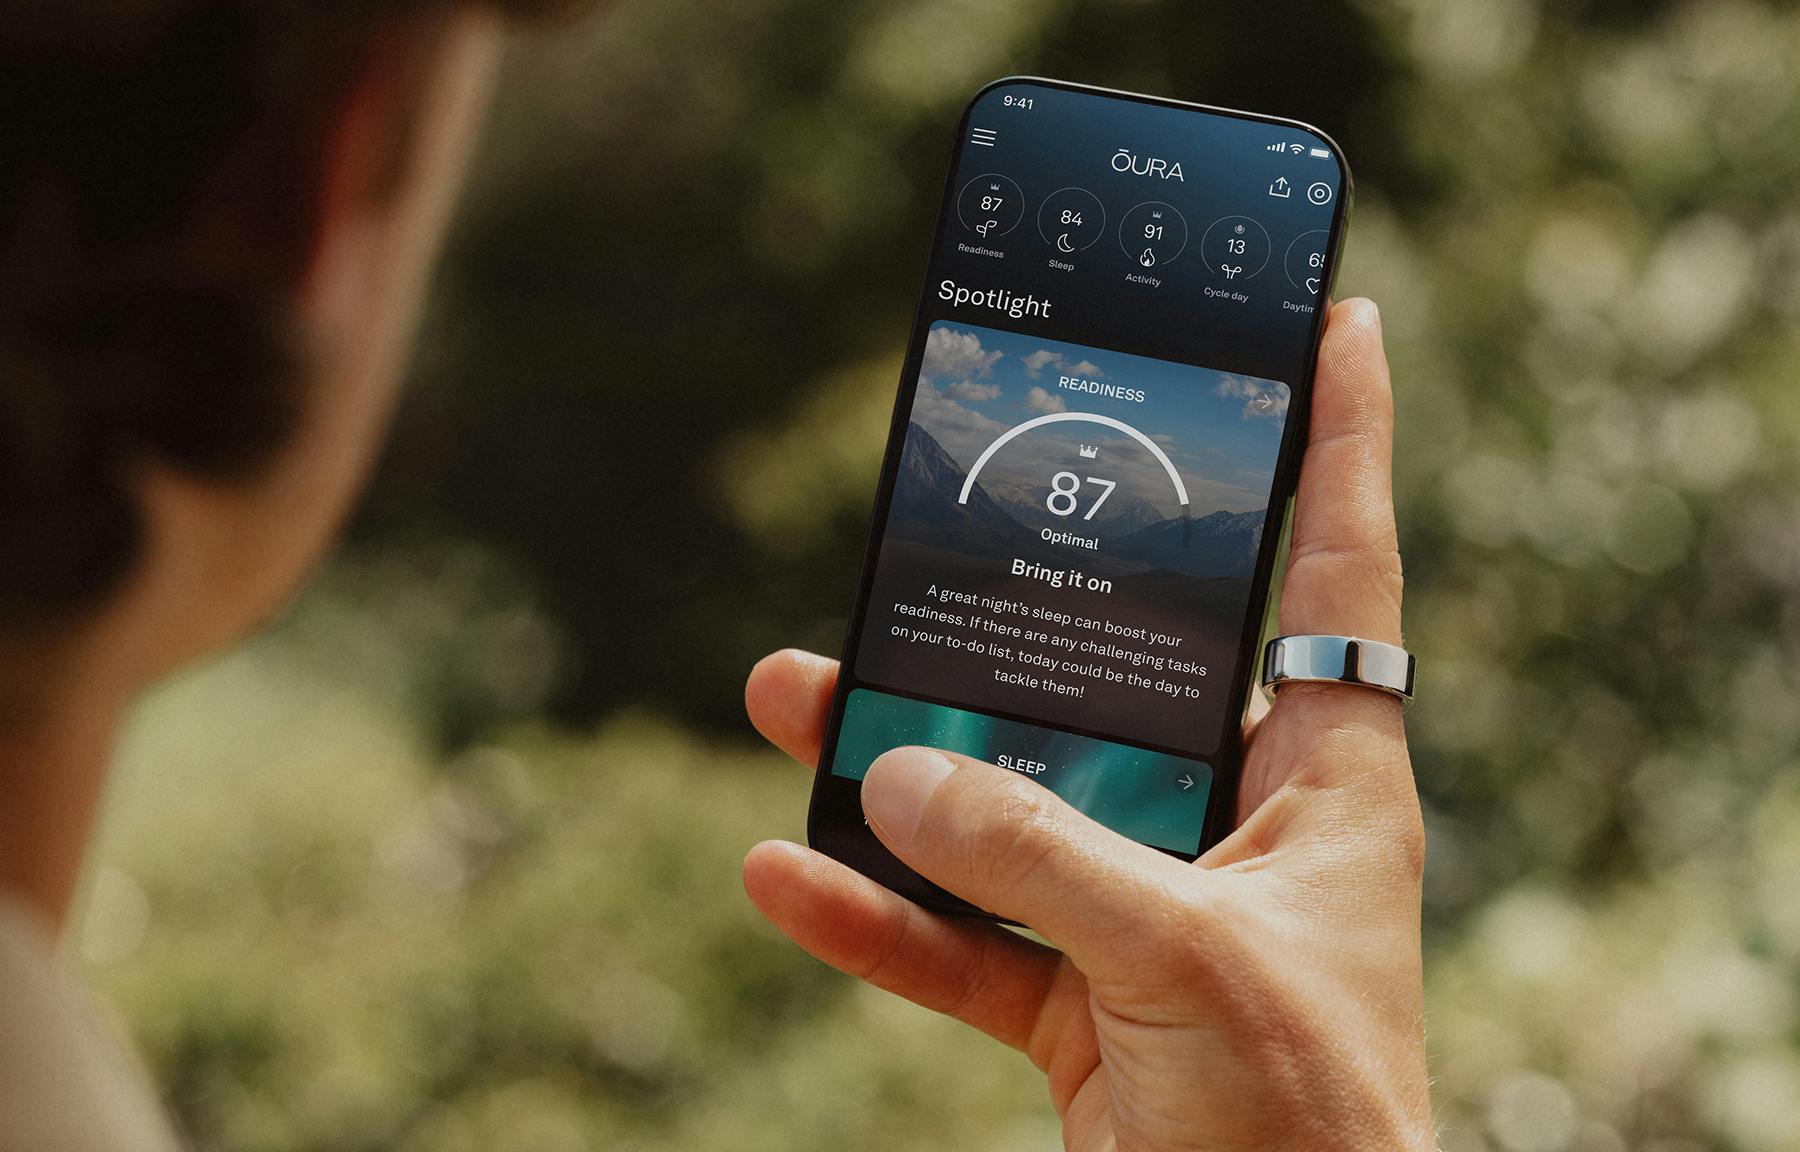
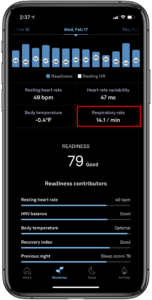
Currently, the Oura App gives the average respiratory rate from your night under the Readiness tab.
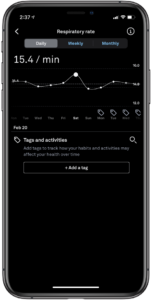
By tapping on this number, you can also expand this view to look at your trend over time. This view answers the question,”Is my breathing rate increased compared to my baseline?” or more widely, “Is something challenging my system?”
A typical range for a healthy adult is 12–20 breaths per minute, and a fluctuation of more than 1-2 breaths per minute is notable.
Keep in mind: PPG respiratory rate is a great way to compare your averages across different nights.
For most people, respiratory rate can be easily determined over the course of the night. However, there are some breathing conditions that may disrupt portions of the nightly signal. In most cases, this will not impact the accuracy of their data, but is worth noting.
For example, the heart of an individual with sleep apnea may keep beating in a pattern that anticipates a normal respiratory sinus arrhythmia (breathe in – speed up, breathe out – slow down). But the actual air flow can be restricted for the individual and may result in a different number of breathing cycles than can be seen in the PPG signal. For most individuals, this is not a problem, especially when you look at long-term trends and deviations from your baseline.