


How much total sleep do you get each night? Do you sleep better on the days you exercised or the days you rested?
As humans, we rely heavily on our memory, so there’s a chance our answers to these questions might be a little inaccurate. Our perceptions don’t always line up with our body’s reality.
With Trends, you can fact-check your perceptions by comparing them to your body’s sleep, activity, and readiness patterns. If you’re viewing trends through your Oura on the Web dashboard, you can add another layer by comparing two variables (i.e., Deep Sleep vs. Bedtime) to gain deeper insights.
LEARN MORE: How to Use Trends
What are Trends?
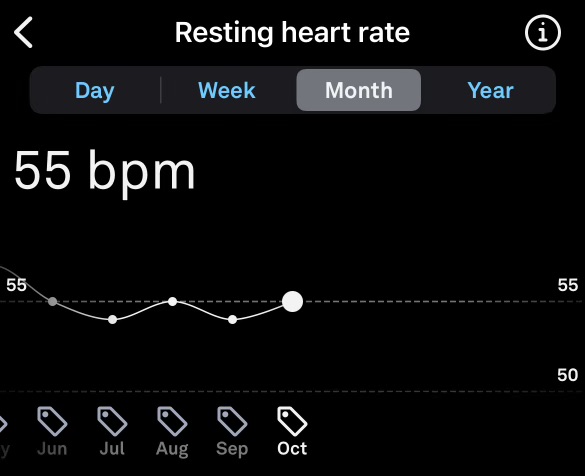
The trends screens display information about your Oura scores and contributors in easy-to-visualize charts and graphs.
Each graph—except for body temperature—provides daily, weekly, monthly, and yearly views. (Year view is currently only available on iOS.)
Viewing your Oura Ring data in the long term is a quick way to see if you are moving toward your personal goals, and to track which variables may be having an impact on your overall health.
Tap any of the displayed trends to view in-depth details.
| Member Spotlight: Oura member Dada J. uses Trends view to monitor changes in her body temperature to help her manage her IBD diagnosis. |
View Your Trends with Oura
To view your Trends in the Oura App:
- Tap the menu (≡) icon in the upper left-hand corner of the Oura home tab.
- Select “Trends.”
- At the top of the screen, you’ll find three featured trends, with a full list of Sleep, Readiness, or Activity, and Stress metrics listed at the bottom.
- Click on a metric (e.g., “Activity goal completion”) to view your data over time.
- Tap any of these elements to view their trend graphs.
The featured trends are curated by Oura’s science team according to what is most relevant to the goal and focus area you selected during the Oura App onboarding process. These trends are also displayed in the app’s Home tab so that they’re always readily accessible.
View Your Trends With Oura on the Web
Go further and compare two variables on your desktop with Oura on the Web. To channel your inner detective and discover correlations within your data:
- Log into your Oura account.
- Select “Trends.”
- Choose the date range (via the dropdown or by dragging the highlighted area on the timeline).
- Choose the unit of time by selecting Daily, Weekly, or Monthly.
- Select the first variable on the left, above the graph.
- Select the second variable on the right, above the graph.
- Compare the two and identify correlations.
If you like raw data and you love spreadsheets, you can export your data as a CSV file by clicking “Export Data” above the graph on the upper right.
Do More With Trends
Use Tags to learn more about your health trends. When you Tag a certain habit consistently, you can see the effects of it when you view Trends.
LEARN MORE: How To Conduct A Self-Experiment With Oura