


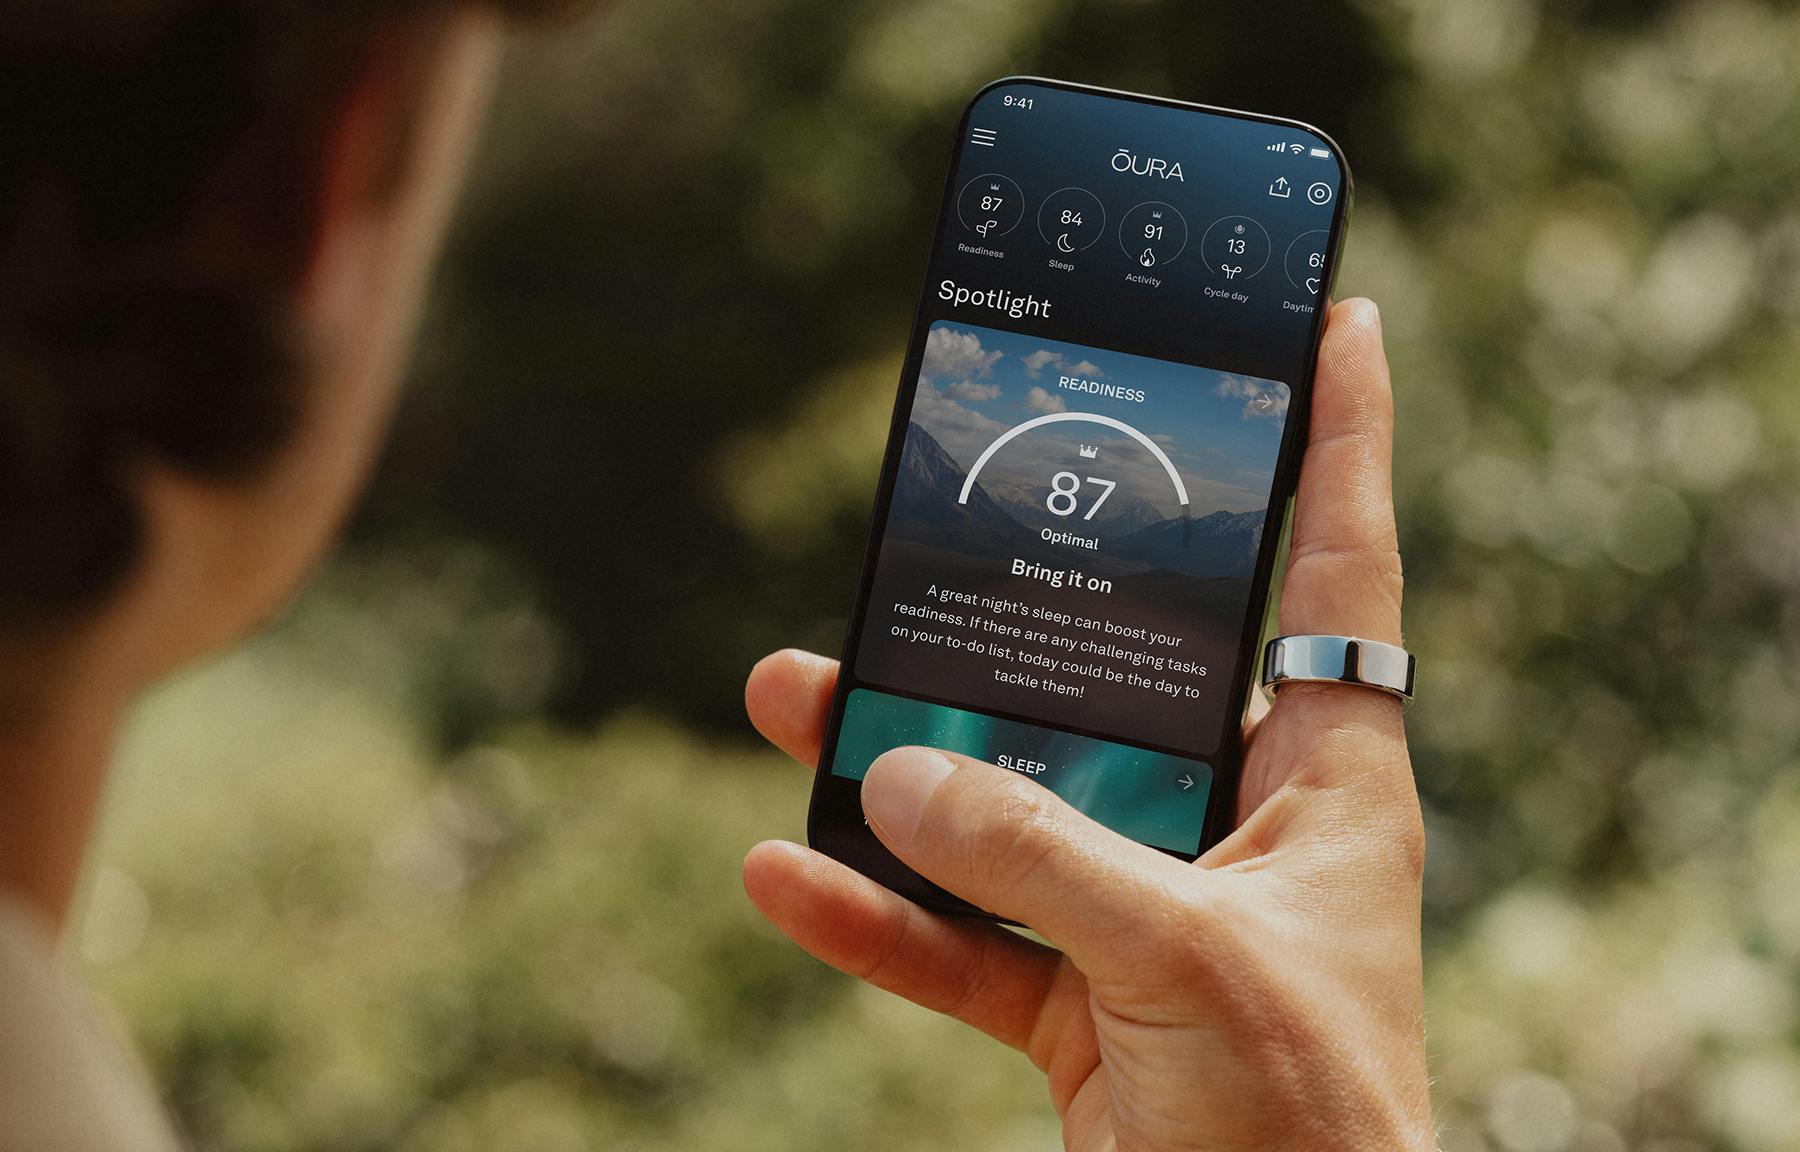


When measuring heart rate variability (HRV) during the night, your minute by minute HRV can dance up and down. To make sense of your data, Oura gives you your entire nighttime HRV trace alongside your average HRV for the night.
Take look at how HRV scores range across Oura members by age and gender.
One of the most helpful metrics is your average HRV as it is the best indicator of the overall stress level on your body. While some wearables calculate your HRV using only a small portion of your night (for example one data point from one sleep stage or at a random time), Oura uses your entire night of HRV data.
Why?
When it comes to HRV, there are no universal best practices so how you calculate your metrics depends on your goal. By using your entire night, Oura aims to give you the full picture of how your body responds to stress.
Using the entire night of data enables Oura to provide you with the best metric for helping you see how your body is responding to all the stress you face that adds up from your acute stressors (for example, a hard workout, travel, getting sick) and long term stressors (for example, work-related worries, life events).
A more representative HRV value can help you make meaningful lifestyle adjustments that can lead to better health and performance.
What Happens to HRV at Night
At night, your HRV can be influenced by two major factors:
- Your circadian rhythm, when your body naturally wants to fall asleep and wake up, causes large changes in your overall trend
- Your stages of sleep cause short term changes that create peaks and valleys in your data from moment to moment
You can see both of these changes in your Oura data.
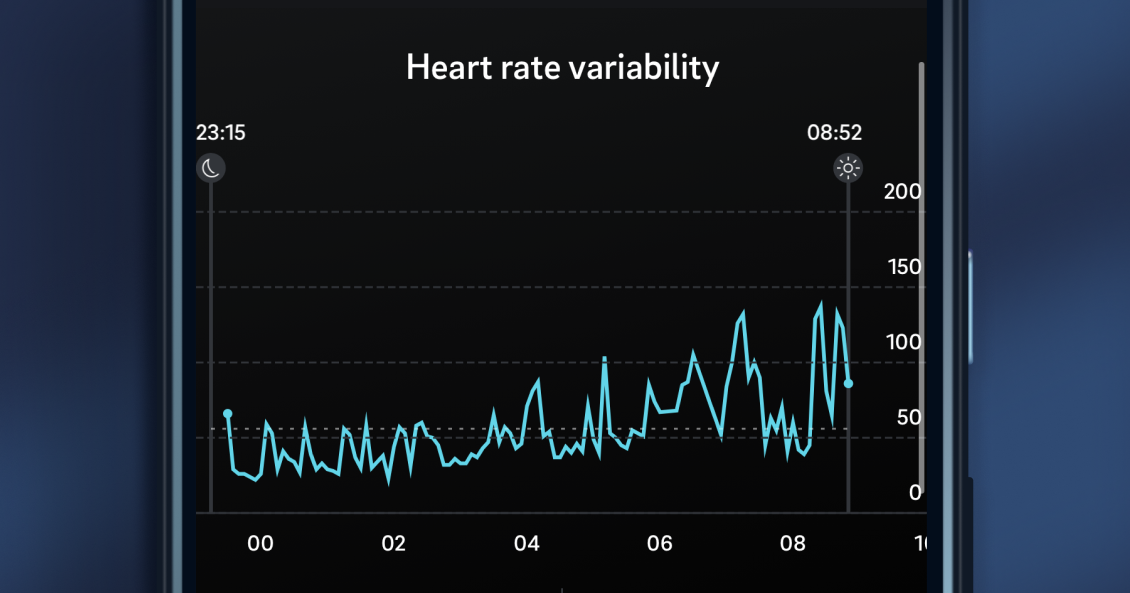
Your Circadian Rhythm: As your circadian rhythm helps your body rest and recover over the course of the night, your HRV slowly climbs and your resting heart rate (RHR) declines. This is a positive sign that your body is recovering from stress and means that your HRV values at the beginning of the night can be very different from values towards the end.
Oura provides the entire nighttime HRV trace so you can follow your body’s journey moment to moment for clues into how your body is recovering.
Keep an eye out for this recovery pattern:
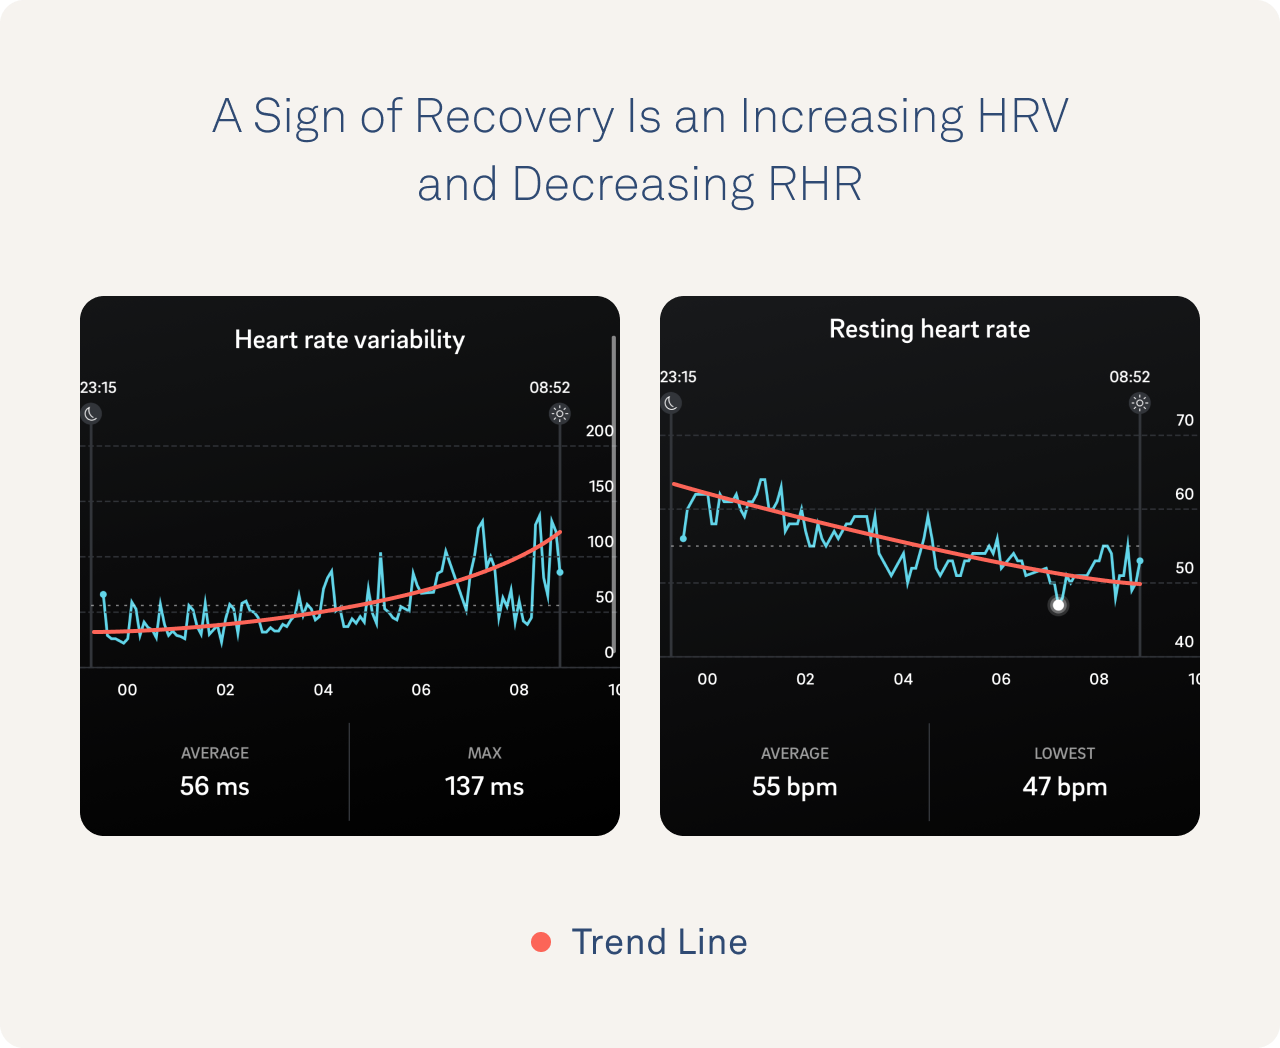
You won’t always see this pattern, however, because patterns of stress can disrupt this natural rhythm. If your body is under strain, you may see that your HRV is unable to increase effectively and your RHR remains high.
Stages of Sleep: In addition to long term changes over the night, there are shorter peaks and valleys in your HRV. As your body cycles through sleep stages, your minute by minute data reflects the differences in how each stage impacts your heart rate and HRV, causing large ups and downs.
For example, you may notice that peaks in your HRV are more likely to align with REM sleep while your HRV “valleys” match up with deep sleep.
Why Use the Entire Night of Data?
With so many ups and downs, you might start to wonder if an average of the entire night is the right measure.
The best answer is to look at other strategies for calculating average HRV:
- Using limited data points from different parts of the night: Some wearables select a few data points or a few minutes of data at different times during the night. This can lead to large differences in HRV values simply because the data points are far apart and we’ve already seen how your circadian rhythm shifts your overall HRV trend over time. As a result, this method may not accurately reflect differences in HRV that are caused by stress.
- Using data from the same time each night: Another strategy is trying to take data from the same time each night to attempt to remove the influence of the circadian rhythm. However, on different days, we could be in different sleep stages at the same time of night which we’ve already seen can cause a large shift in HRV. For example, yesterday at 4 am I might have been in deep sleep, while the day before in REM sleep.
- Using data from the same sleep stage each night: Some wearables may also try to remove the influence of sleep stages (those small peaks and valleys) by selecting a single sleep stage and comparing HRV values only for that stage from night to night. However, because your deep sleep (or any other stage) could occur at any time during the night (e.g., 11 pm or 5 am) this method is once again affected by the influence of the circadian rhythm.
To sum up, all of the changes from your circadian rhythm and sleep stages make these strategies less than ideal for getting a snapshot of your baseline level of stress.
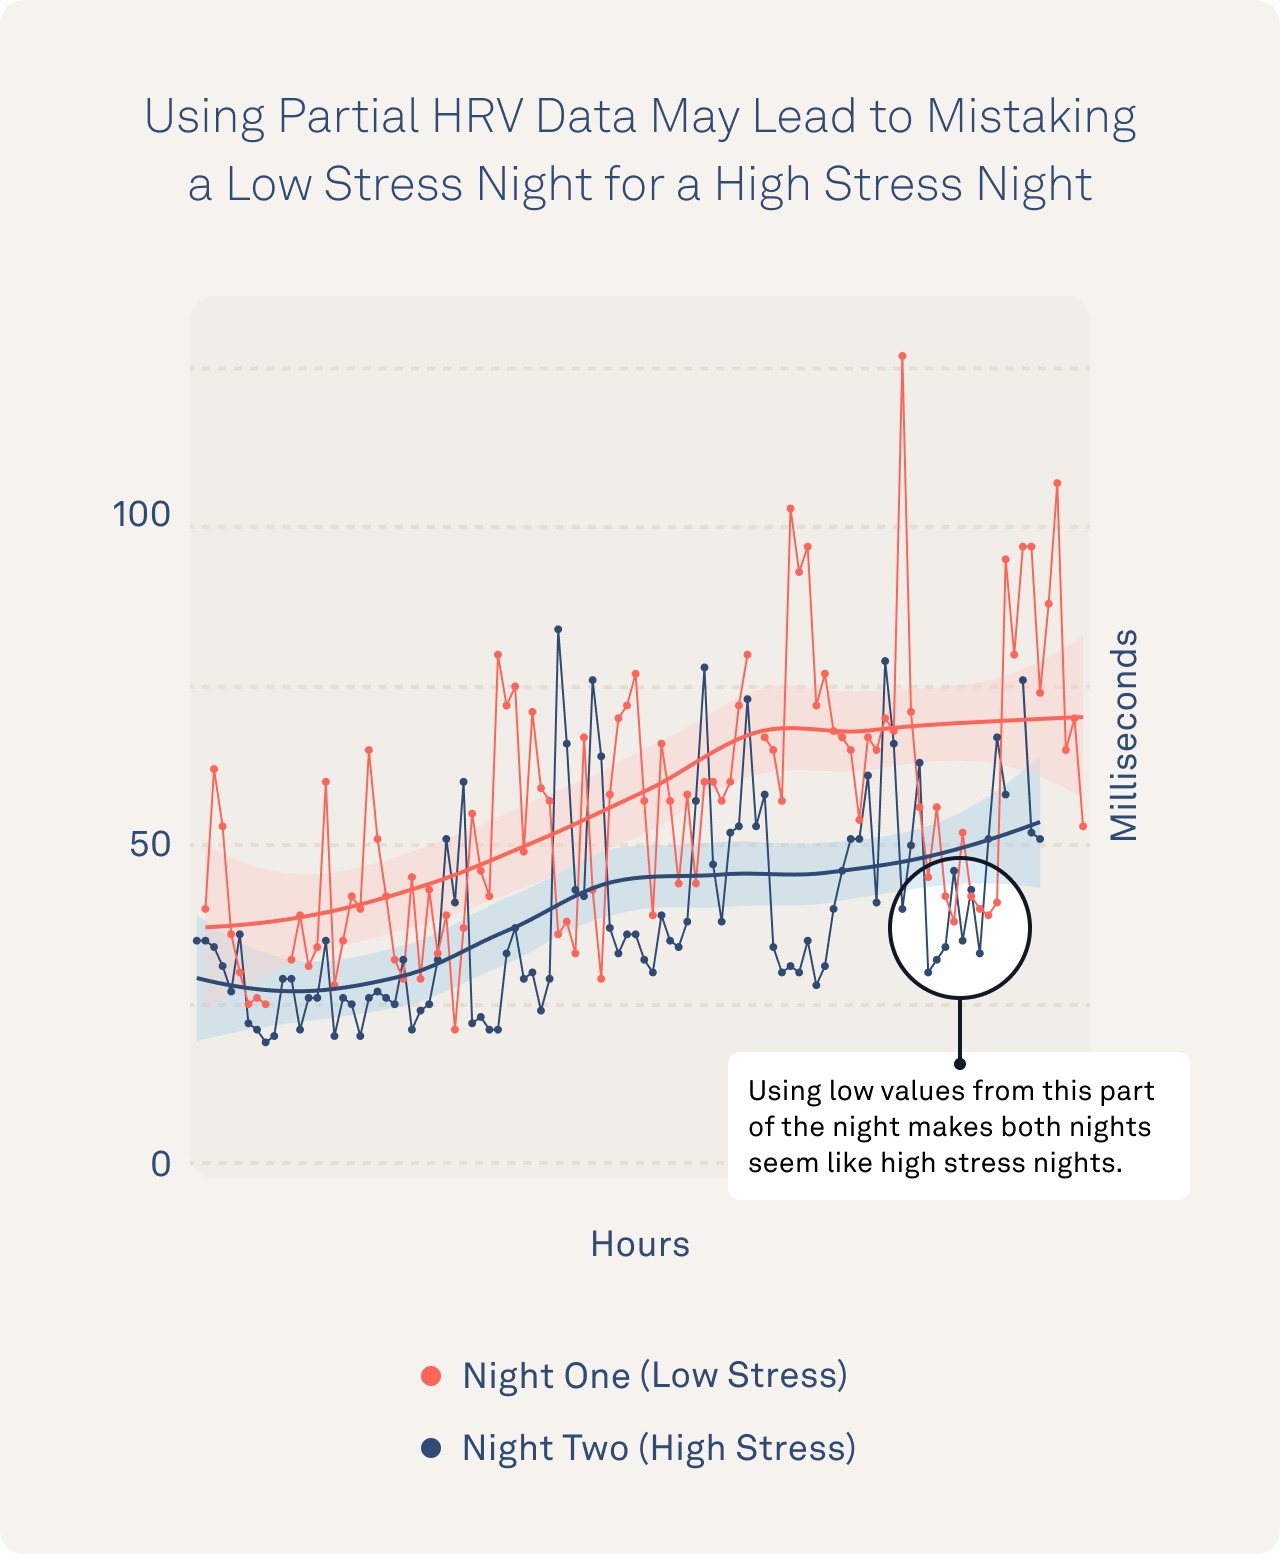
An Example
In the figure below, we can see HRV values over the course of two separate nights. You can clearly spot how picking a single data point (or just a few) to serve as the HRV average for the night can easily misrepresent stress levels for this person. For these reasons, Oura uses the entire night of data to provide you with the most reliable physiological stress assessment based on HRV.
About The Oura Expert
Marco Altini, PhD, holds a PhD cum laude in applied machine learning, a M.Sc. cum laude in computer science engineering, and a M.Sc. cum laude in human movement sciences and high-performance coaching. He has published more than 50 papers and patents at the intersection between physiology, health, technology, and human performance. He is co-founder of HRV4Training, advisor at Oura, guest lecturer at VU Amsterdam, and editor for IEEE Pervasive Computing Magazine. He loves running.